Unlock a world of possibilities! Login now and discover the exclusive benefits awaiting you.

- Qlik Community
- :
- Blogs
- :
- Technical
- :
- Design
- :
- The As-Of Table

.png "Former Employee") hic
hic
- Subscribe to RSS Feed
- Mark as New
- Mark as Read
- Bookmark
- Subscribe
- Printer Friendly Page
- Report Inappropriate Content
Last week I wrote about how the Above() function can be used for calculating rolling averages and other accumulations. There is however also an alternative method for doing the same thing:
The As-Of table.
When you use the Above() function, you fetch a number from other rows in a chart or Aggr() table. The As-Of table is slightly different in this respect: It is not a transient table created by an object or an expression – instead it is a real table in the data model.
The idea is to create a secondary month field – the AsOfMonth - that links to multiple real months.
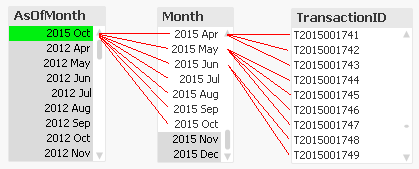
In the example above, you can see that ‘2015 Oct’ links to several preceding months, and each Month in turn links to several rows in a fact table. This means that a specific transaction will be linked to several AsOfMonths.
In the data model, the As-Of table should appear as a separate calendar table that links to the existing primary calendar table:
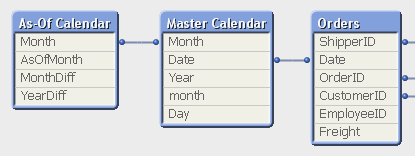
One way to create this table is the following:
First, make sure that you in your master calendar have a field “Month” that is defined as the first date of the month, e.g.
Date(MonthStart(Date),'YYYY MMM') as Month,
Then add the following lines at the end of the script:
// ======== Create a list of distinct Months ========
tmpAsOfCalendar:
Load distinct Month
Resident [Master Calendar] ;
// ======== Cartesian product with itself ========
Join (tmpAsOfCalendar)
Load Month as AsOfMonth
Resident tmpAsOfCalendar ;
// ======== Reload, filter and calculate additional fields ========
[As-Of Calendar]:
Load Month,
AsOfMonth,
Round((AsOfMonth-Month)*12/365.2425) as MonthDiff,
Year(AsOfMonth)-Year(Month) as YearDiff
Resident tmpAsOfCalendar
Where AsOfMonth >= Month;
Drop Table tmpAsOfCalendar;
Once this table has been created, you can use the AsOfMonth as dimension in charts where you want rolling averages and accumulations.
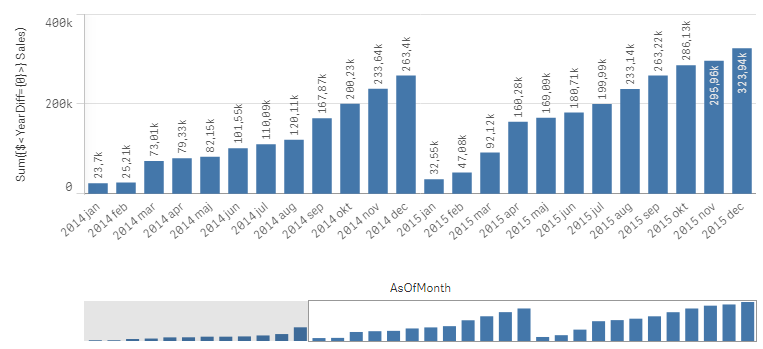
If you as measure use
Sum({$<YearDiff={0}>} Sales)
you will get a yearly accumulation – year-to-date up until the day of the script run.
If you instead use
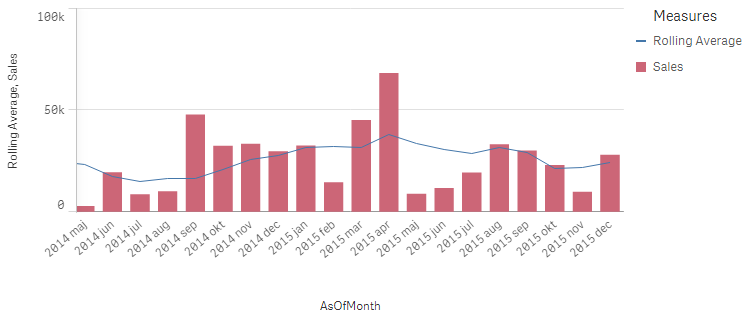
Sum({$<MonthDiff={"<6"}>} Sales) / Count(distinct {$<MonthDiff={"<6"}>} Month)
you will get a 6-month rolling average:
And finally, if you use
Sum({$<MonthDiff={0}>} Sales)
You will get the real, non-accumulated numbers.
I have made the Set Analysis expressions based on two fields: YearDiff and MonthDiff. However, for clarity it could be a good idea to add flags in the As-Of table, so that the Set Analysis expressions become even simpler, e.g.
If(MonthDiff=0,1,0) as IsSameMonth,
If(YearDiff=0,1,0) as IsSameYear,
If(MonthDiff<6,1,0) as IsRolling6,
Summary: The As-Of table is a good way to calculate rolling averages and accumulations.
Further reading related to this topic:
Calculating rolling n-period totals, averages or other aggregations
You must be a registered user to add a comment. If you've already registered, sign in. Otherwise, register and sign in.