Do not input private or sensitive data. View Qlik Privacy & Cookie Policy.
Skip to main content

Announcements
Talend Cloud AWS EU Scheduled Outage: Starting Tues 26 May 21:00 CEST with expected completion Wed 27 May 01:00 CEST
hic
Former Employee
Former Employee

Last week I wrote about how the Above() function can be used for calculating rolling averages and other accumulations. There is however also an alternative method for doing the same thing:

The As-Of table.

When you use the Above() function, you fetch a number from other rows in a chart or Aggr() table. The As-Of table is slightly different in this respect: It is not a transient table created by an object or an expression – instead it is a real table in the data model.

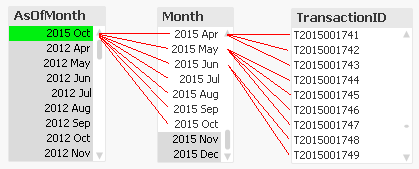
The idea is to create a secondary month field – the AsOfMonth - that links to multiple real months.
 

Fields.png


In the example above, you can see that ‘2015 Oct’ links to several preceding months, and each Month in turn links to several rows in a fact table. This means that a specific transaction will be linked to several AsOfMonths.

In the data model, the As-Of table should appear as a separate calendar table that links to the existing primary calendar table:
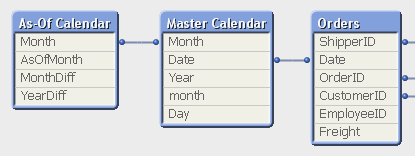
 

DataModel.png


One way to create this table is the following:

First, make sure that you in your master calendar have a field “Month” that is defined as the first date of the month, e.g.


Date(MonthStart(Date),'YYYY MMM') as Month,


Then add the following lines at the end of the script:


// ======== Create a list of distinct Months ========
tmpAsOfCalendar:
Load distinct Month
  Resident [Master Calendar] ;

// ======== Cartesian product with itself ========
Join (tmpAsOfCalendar)
Load Month as AsOfMonth
  Resident tmpAsOfCalendar ;

// ======== Reload, filter and calculate additional fields ========
[As-Of Calendar]:
Load Month,
  AsOfMonth,
  Round((AsOfMonth-Month)*12/365.2425) as MonthDiff,
  Year(AsOfMonth)-Year(Month) as YearDiff
  Resident tmpAsOfCalendar
      Where AsOfMonth >= Month;

Drop Table tmpAsOfCalendar;


Once this table has been created, you can use the AsOfMonth as dimension in charts where you want rolling averages and accumulations.

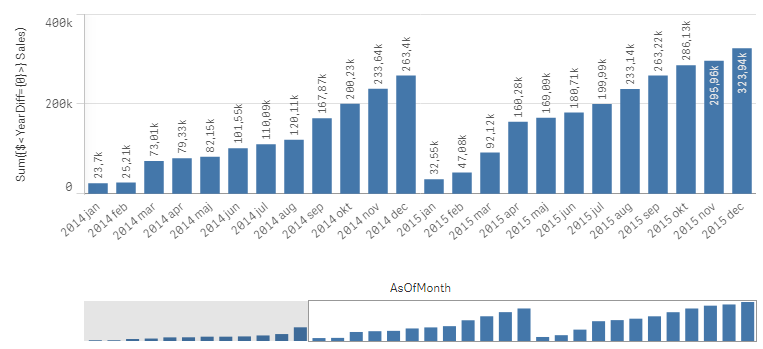
If you as measure use


Sum({$<YearDiff={0}>} Sales)


you will get a yearly accumulation – year-to-date up until the day of the script run.
 

Yearly accumulation.png


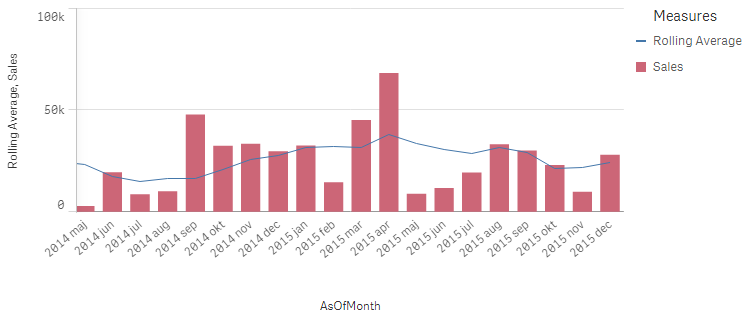
If you instead use


Sum({$<MonthDiff={"<6"}>} Sales) / Count(distinct {$<MonthDiff={"<6"}>} Month)


you will get a 6-month rolling average:
 

Rolling average.png

And finally, if you use


Sum({$<MonthDiff={0}>} Sales)


You will get the real, non-accumulated numbers.

I have made the Set Analysis expressions based on two fields: YearDiff and MonthDiff. However, for clarity it could be a good idea to add flags in the As-Of table, so that the Set Analysis expressions become even simpler, e.g.


If(MonthDiff=0,1,0) as IsSameMonth,
If(YearDiff=0,1,0) as IsSameYear,
If(MonthDiff<6,1,0) as IsRolling6,


Summary: The As-Of table is a good way to calculate rolling averages and accumulations.


HIC


Further reading related to this topic:

The Above Function

Accumulations

Calculating rolling n-period totals, averages or other aggregations

104 Comments
hic
Former Employee
Former Employee

There are several errors in your code, e.g. you use the field "WEEK" in your tmpAsOfCalendar - a field that does not exist.

I would use

Dual(WeekYear(Date) &' W'& Num(Week(Date),'00'),WeekStart(Date)) as Week,

and

// ======== Create a list of distinct Weeks ========
tmpAsOfCalendar:
Load distinct
Week
Resident [Master Calendar] ;

// ======== Cartesian product with itself ========
Join (tmpAsOfCalendar)
Load
Week as AsOfWeek
Resident tmpAsOfCalendar ;

// ======== Reload, filter and calculate additional fields ========
[As-Of Calendar]:
Load
Week,
AsOfWeek,
Round((AsOfWeek-Week)/7) as WeekDiff,
Year(AsOfWeek)-Year(Week) as YearDiff
Resident tmpAsOfCalendar
Where AsOfWeek >= Week;

Drop Table tmpAsOfCalendar;

1,570 Views
Not applicable

Hi Henric, Thank you so much for the help.

Can we use As of week, As of month, AS of day in a same calender.

Regards

Cena

0 Likes
1,570 Views
asmithids
Partner - Creator II

Hi,

I have a 12 month rolling average line chart in Qlik Sense based on this post.  My data set goes back to 2001.  For the rolling average chart, I only want to show the latest 3 years?  Question, how can I limit the chart to a 3 year view with the rolling 12 month average based on the whole 15 year data set?

Thank you!

0 Likes
1,526 Views
Gysbert_Wassenaar
Partner - Champion III

Assuming you have an AsOfMonth field like described in the blog post then you can add a set modifier to your expression(s) to select only the last three years.

Avg({$<MonthDiff={"<12"},AsOfMonth={">$(=AddYears(Max(AsOfMonth),-3))<=$(=Max(AsOfMonth))"}>} Value)

0 Likes
1,526 Views
asmithids
Partner - Creator II

Thank you Gysbert. That worked!

1,526 Views
Not applicable

Hi guys,

I have to get an accumulated count distinct of suppliers from the very beginning of my data up to now. I already implemented the AsOf Table following Henric's method, but I struggle to get the right formula.

I also have to show in the bar chart only the year and the month selected.

Could you help me?

Many Thanks!

M

0 Likes
1,526 Views
ananyaghosh
Creator III
Creator III

Hi,

I am using below script for creating as of table:

AsOfTable:
LOAD "Process Date" as AsOfProcessDate,
"Process Date",
'Current Date'
as FlagDate,
"Month ID" as AsOfProcessMonth,
"Month ID",
'Current Month'
as FlagMonth
Resident [Dim Date];

Concatenate (AsOfTable)
LOAD
"Process Date" as AsOfProcessDate,
Date("Process Date" - 1) as [Process Date],
'Previous Date'
as FlagDate,
"Month ID" as AsOfProcessMonth,
"Previous Month ID"  as "Month ID",
'Previous Month'
as FlagMonth 
Resident [Dim Date];

[As-Of Calendar]:
Load
AsOfProcessDate
AsOfProcessMonth,
FlagDate,
FlagMonth
//Round((AsOfMonth-Month)*12/365.2425) as MonthDiff,
  //Year(AsOfMonth)-Year(Month) as YearDiff
  Resident AsOfTable;
// Where AsOfMonth >= Month;

Drop Table AsOfTable;

now I attached the QVW file. Please tell what is wrong here

0 Likes
1,526 Views
Anonymous
Not applicable

hicgwassenaar how to use as-of-table for Year-to-Go (YTG) and 12-months-rolling-forecast not rolling 12 months past trend? For example, assuming calendar year as fiscal year, if I select April 2017, for YTG it gives May 2017 to Dec 2017 sales and for 12 months-Rolling-Forecast, it gives May 2017 to April 2018 sales.

0 Likes
1,526 Views
Gysbert_Wassenaar
Partner - Champion III

Same problem. Instead of linking the previous twelve months with an AsOf month you need to link the next twelve months to the AsOf month.

If you use the script in the blog post then change the line

     Where AsOfMonth >= Month;

into

     Where AsOfMonth <= Month;

And take into account that you'll have negative MonthDiff values. Perhaps you'll want to change that too.


0 Likes
1,492 Views
jpbartolomeo
Partner - Contributor III

Dear community,

How do I do to implement the As-Of Table with a Fiscal Calendar? I have my master calendar with fiscal year, exactly like this other post of Henric: Fiscal Year. Any thoughts?

Thanks in advance,

John.

0 Likes
1,492 Views
