Announcements
Join us at Qlik Connect for 3 magical days of learning, networking,and inspiration! REGISTER TODAY and save!
hic
Former Employee
Former Employee

Last week I wrote about how the Above() function can be used for calculating rolling averages and other accumulations. There is however also an alternative method for doing the same thing:

The As-Of table.

When you use the Above() function, you fetch a number from other rows in a chart or Aggr() table. The As-Of table is slightly different in this respect: It is not a transient table created by an object or an expression – instead it is a real table in the data model.

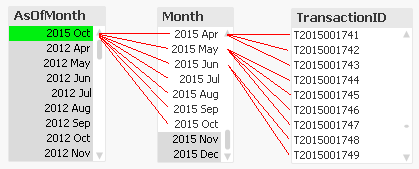
The idea is to create a secondary month field – the AsOfMonth - that links to multiple real months.
 

Fields.png


In the example above, you can see that ‘2015 Oct’ links to several preceding months, and each Month in turn links to several rows in a fact table. This means that a specific transaction will be linked to several AsOfMonths.

In the data model, the As-Of table should appear as a separate calendar table that links to the existing primary calendar table:
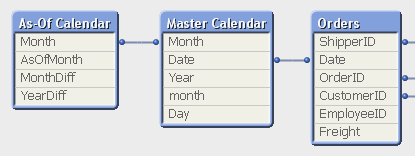
 

DataModel.png


One way to create this table is the following:

First, make sure that you in your master calendar have a field “Month” that is defined as the first date of the month, e.g.


Date(MonthStart(Date),'YYYY MMM') as Month,


Then add the following lines at the end of the script:


// ======== Create a list of distinct Months ========
tmpAsOfCalendar:
Load distinct Month
  Resident [Master Calendar] ;

// ======== Cartesian product with itself ========
Join (tmpAsOfCalendar)
Load Month as AsOfMonth
  Resident tmpAsOfCalendar ;

// ======== Reload, filter and calculate additional fields ========
[As-Of Calendar]:
Load Month,
  AsOfMonth,
  Round((AsOfMonth-Month)*12/365.2425) as MonthDiff,
  Year(AsOfMonth)-Year(Month) as YearDiff
  Resident tmpAsOfCalendar
      Where AsOfMonth >= Month;

Drop Table tmpAsOfCalendar;


Once this table has been created, you can use the AsOfMonth as dimension in charts where you want rolling averages and accumulations.

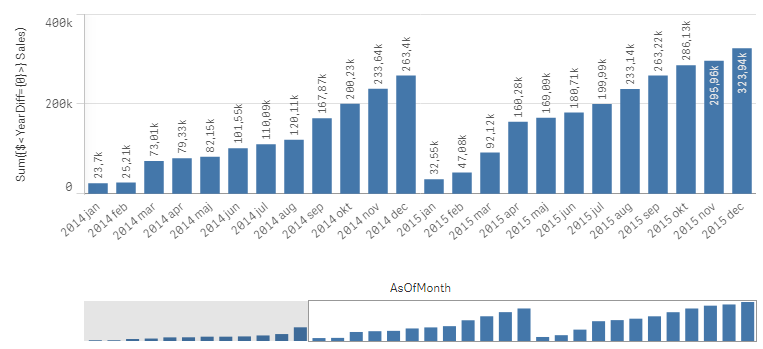
If you as measure use


Sum({$<YearDiff={0}>} Sales)


you will get a yearly accumulation – year-to-date up until the day of the script run.
 

Yearly accumulation.png


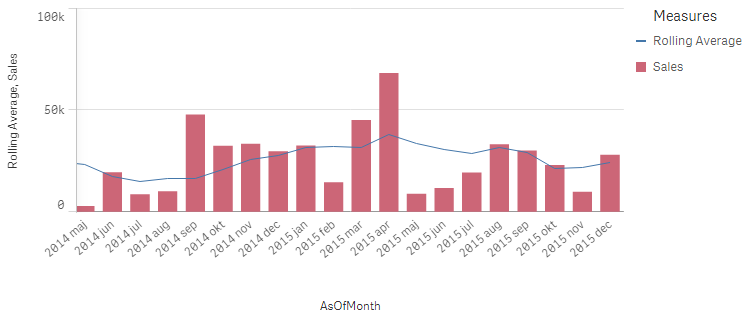
If you instead use


Sum({$<MonthDiff={"<6"}>} Sales) / Count(distinct {$<MonthDiff={"<6"}>} Month)


you will get a 6-month rolling average:
 

Rolling average.png

And finally, if you use


Sum({$<MonthDiff={0}>} Sales)


You will get the real, non-accumulated numbers.

I have made the Set Analysis expressions based on two fields: YearDiff and MonthDiff. However, for clarity it could be a good idea to add flags in the As-Of table, so that the Set Analysis expressions become even simpler, e.g.


If(MonthDiff=0,1,0) as IsSameMonth,
If(YearDiff=0,1,0) as IsSameYear,
If(MonthDiff<6,1,0) as IsRolling6,


Summary: The As-Of table is a good way to calculate rolling averages and accumulations.


HIC


Further reading related to this topic:

The Above Function

Accumulations

Calculating rolling n-period totals, averages or other aggregations

104 Comments
cse
Contributor
Contributor

I am using the as-of table with a 12 months rolling average, with a chart showing all data available. How can I limit to only show the last full 24 months in my chart?


I would still like to correctly calculate a 12 months rolling average for all the 24 months in the chart , by using the previous months not shown in the chart.


0 Likes
1,918 Views
Vyacheslav_Mihalchuk
Contributor
Contributor

Thank you for the information

0 Likes
1,715 Views
Lauri
Specialist
Specialist

The AsOf table is the gift that keeps on giving! Thank you for providing this method.

I am curious if others think the below is a good method of dealing with multiple set analysis conditions with different timeframe requirements (two look back four quarters, another looks back eight quarters). 

I concatenated two types of data (visits, diagnosis) into a FACT table containing [PatientID], [FactType], [AgeAtEvent], [CC], and [Date]. [Date] links to a common calendar and the common calendar links to an As-Of table on [Year-Month]. 

My table's dimension is [AsOfQuarter].

My measure is:

=Count(DISTINCT {
  <PatientID=p({<FactType={'VI'}, IsRolling4Q={1}, AgeAtEvent={">=18<=85"}, AsOfQuarter>})>
*<PatientID=p({<FactType={'CC'}, [CC]={'Hypertension'}, IsRolling8Q={1}, AsOfQuarter>})>
*<PatientID=E({<FactType={'CC'}, [CC]={'Pregnancy', 'ESRD'}, IsRolling4Q={1}, AsOfQuarter>})>
*<IsRolling4Q={1}>} PatientID)

In summary, I am identifying patients who had a visit in rolling 4 quarters, were diagnosed with Hypertension in rolling 8 quarters, were not diagnosed with pregnancy or ESRD in rolling 4 quarters, and I am counting them over rolling 4 quarters in my table. It does appear to return correct results, and the performance is good.

Thanks for any feedback.

1,494 Views
barnabyd
Partner - Creator III

G'day Lauri,

I'm glad you brought this post back into my Daily Digest. The As-Of table is just the right solution for one of my current clients!

Regarding your code above, I don't have any comments on your solution except to say that I can see how your use of P() and E() are being used to solve your problem.

Having said that, whenever I see long and complex set analysis expressions, I always look for ways to simplify  and streamline them by pre-calculating as much as possible in the load script. In my experience the P() and E() functions don't generally translate well into load script code, but your filtering could be pre-calculated as flags. Here's how I would simplify:

= Count( DISTINCT {
  <PatientID=p({< is4QVisit={1}, AsOfQuarter >})>
* <PatientID=p({< isHypertension8Q={1}, AsOfQuarter>})>
* <PatientID=E({< isExcluded4Q={1}, AsOfQuarter>})>
* <IsRolling4Q={1}>} PatientID )

I hope this is a useful comment.

Cheers,

Barnaby.

1,442 Views
Lauri
Specialist
Specialist

Thanks, Barnaby, that is useful. I bet getting rid of text searches will speed up the performance. I appreciate the reply!

1,428 Views
Bellamy
Contributor II
Contributor II

Hello, thank you for this guide!
How to perform a 12m rolling of current month(example) versus 12m rolling of previous month using the AsOfTable?

I would like to have a pivot table in which it display the last 3 months (asoftable month with the 12 month rolling on each of them) + the delta between month and previous one (in total 2 deltas).

Thank you in advance

1,205 Views
Junior-Qlik
Contributor
Contributor

Hi

I am new to Qlik. I am not very good in English, but I will try to expose my doubt: I have tried to recreate these measures, but the values do not accumulate on a monthly basis.

My goal is to create cumulative time measurements: MTH, QTR, YTD, and MAT. And that when selecting a specific month, everything is filtered according to the selected month.

This is my master calendar:

[Master Calendar]:

QuartersMap:
MAPPING LOAD
rowno() as Month,
'Q' & Ceil (rowno()/3) as Quarter
AUTOGENERATE (12);

Temp:
Load
min("Periodo") as minDate,
max("Periodo") as maxDate
Resident ENLACE;


Let varMinDate = Num(Peek('minDate', 0, 'Temp'));
Let varMaxDate = Num(Peek('maxDate', 0, 'Temp'));
DROP Table Temp;

TempCalendar:
LOAD
$(varMinDate) + Iterno()-1 As Num,
Date($(varMinDate) + IterNo() - 1) as TempDate
AutoGenerate 1 While $(varMinDate) + IterNo() -1 <= $(varMaxDate);

MasterCalendar:
Load
Date(TempDate,'YYYY MMM') AS Periodo,
MonthStart(TempDate) as Month,
num(Month(TempDate)) as NumMes,
week(TempDate) As Semana,
Year(TempDate) As Año,
Month(TempDate) As Mes,
Day(TempDate) As Dia,
YeartoDate(TempDate)*-1 as CurYTDFlag,
YeartoDate(TempDate,-1)*-1 as LastYTDFlag,
ApplyMap('QuartersMap', month(TempDate), Null()) as Trimestre,
Week(weekstart(TempDate)) & '-' & WeekYear(TempDate) as WeekYear,
WeekDay(TempDate) as WeekDay
Resident TempCalendar
Order By TempDate ASC;
Drop Table TempCalendar;

// ======== Create a list of distinct Months ========
tmpAsOfCalendar:
Load distinct Month
Resident MasterCalendar;

// ======== Cartesian product with itself ========
Join (tmpAsOfCalendar)
Load Month as AsOfMonth
Resident tmpAsOfCalendar ;

// ======== Reload, filter and calculate additional fields ========
[As-Of Calendar]:
Load Month,
AsOfMonth,
Round((AsOfMonth-Month)*12/365.2425) as MonthDiff,
Year(AsOfMonth)-Year(Month) as YearDiff
Resident tmpAsOfCalendar
Where AsOfMonth >= Month;

Drop Table tmpAsOfCalendar;


I finally replicated the formula: "Sum({$<YearDiff={0}>} Sales)", but it didn't rack me up

Please if you can help me. Thanks!


1,132 Views
rpennacchi
Contributor III
Contributor III

@Junior-Qlik 

Are you using the field "AsOfMonth" as a dimension in your chart?

996 Views
Mazarinen
Contributor II
Contributor II

Hello, 

Is there a way to achieve the same thing without an as-of-table for rolling total?

Mazarinen_0-1691675148999.png

when I use the above() function in the expression it start the count from the active filters, I want it to start from the first value e.g. 2020-01-01 and if I filter to May 2020 I don't want the rolling average to start counting from first of May but from the beginning first of January but zoom in on May...

Is there a way to do this without the as-of table?


Thanks for the great post.

735 Views
marcus_sommer

I think your question isn't really related to the features from an as-of-table else more to the selection states. In your case you couldn't just use one selection state else you need to combine several ones. This may in your case look like:

rangesum(above(sum({ < Date = {...}, Month, Week >} Field), 0, rowno())) *
sign(count(distinct Date)) 

whereby the bold-marked set analysis defined the wanted data-set with a start- and end-date as well as ignoring selections within unwanted fields - which creates an own selection state. Just using this your chart would start by the first January and discard the made period-selection. To consider them, too is the second part which worked like a boolean factor because the count() within sign() has no separate state included will therefore react normally on the made selection and all possible dates will return TRUE and the exclude ones FALSE which should restrict the available dimension-values again.

Depending on your data-model and requirements you may need a bit more complex approach by nesting the above logic within an aggr() and/or adding some other stuff - but the main-logic will remain the same that tasks like yours couldn't be solved within a single selection state.

708 Views