Unlock a world of possibilities! Login now and discover the exclusive benefits awaiting you.
- Qlik Community
- :
- All Forums
- :
- GeoAnalytics
- :
- Re: Bubble layer - restrict which bubbles are show...
- Subscribe to RSS Feed
- Mark Topic as New
- Mark Topic as Read
- Float this Topic for Current User
- Bookmark
- Subscribe
- Mute
- Printer Friendly Page
- Mark as New
- Bookmark
- Subscribe
- Mute
- Subscribe to RSS Feed
- Permalink
- Report Inappropriate Content
Bubble layer - restrict which bubbles are shown based on formula/measure
I am working on mapping data onto cities in Switzerland. Since many Swiss cities are not found in the lookup service, I'm using a file I found of all Swiss cities and their Latitude and Longitude. Connected in my database is demographic data (population density, age, etc) and another file with Sales, Categories, Orders, etc. In the bubbler layer, I would like to display cities according to certain measures. Example conditions would be: those with Sales data over a certain number, or those a population over a certain amount. So far, I've only been able to display all cities, with measures for size and color. But with over 4000 cities, they cover each other up and I can't see the cities I'd like to highlight.
Is there a way to limit which bubbles in a bubble layer are displayed, based on a formula/measure?
- Mark as New
- Bookmark
- Subscribe
- Mute
- Subscribe to RSS Feed
- Permalink
- Report Inappropriate Content
Hi,
The number of bubbles is controlled by the dimension.
One way is to use a calculated dimension with threshold, like this:
=if(citysize>100000,city)
Thanks,
Patric Nordström
Qlik
- Mark as New
- Bookmark
- Subscribe
- Mute
- Subscribe to RSS Feed
- Permalink
- Report Inappropriate Content
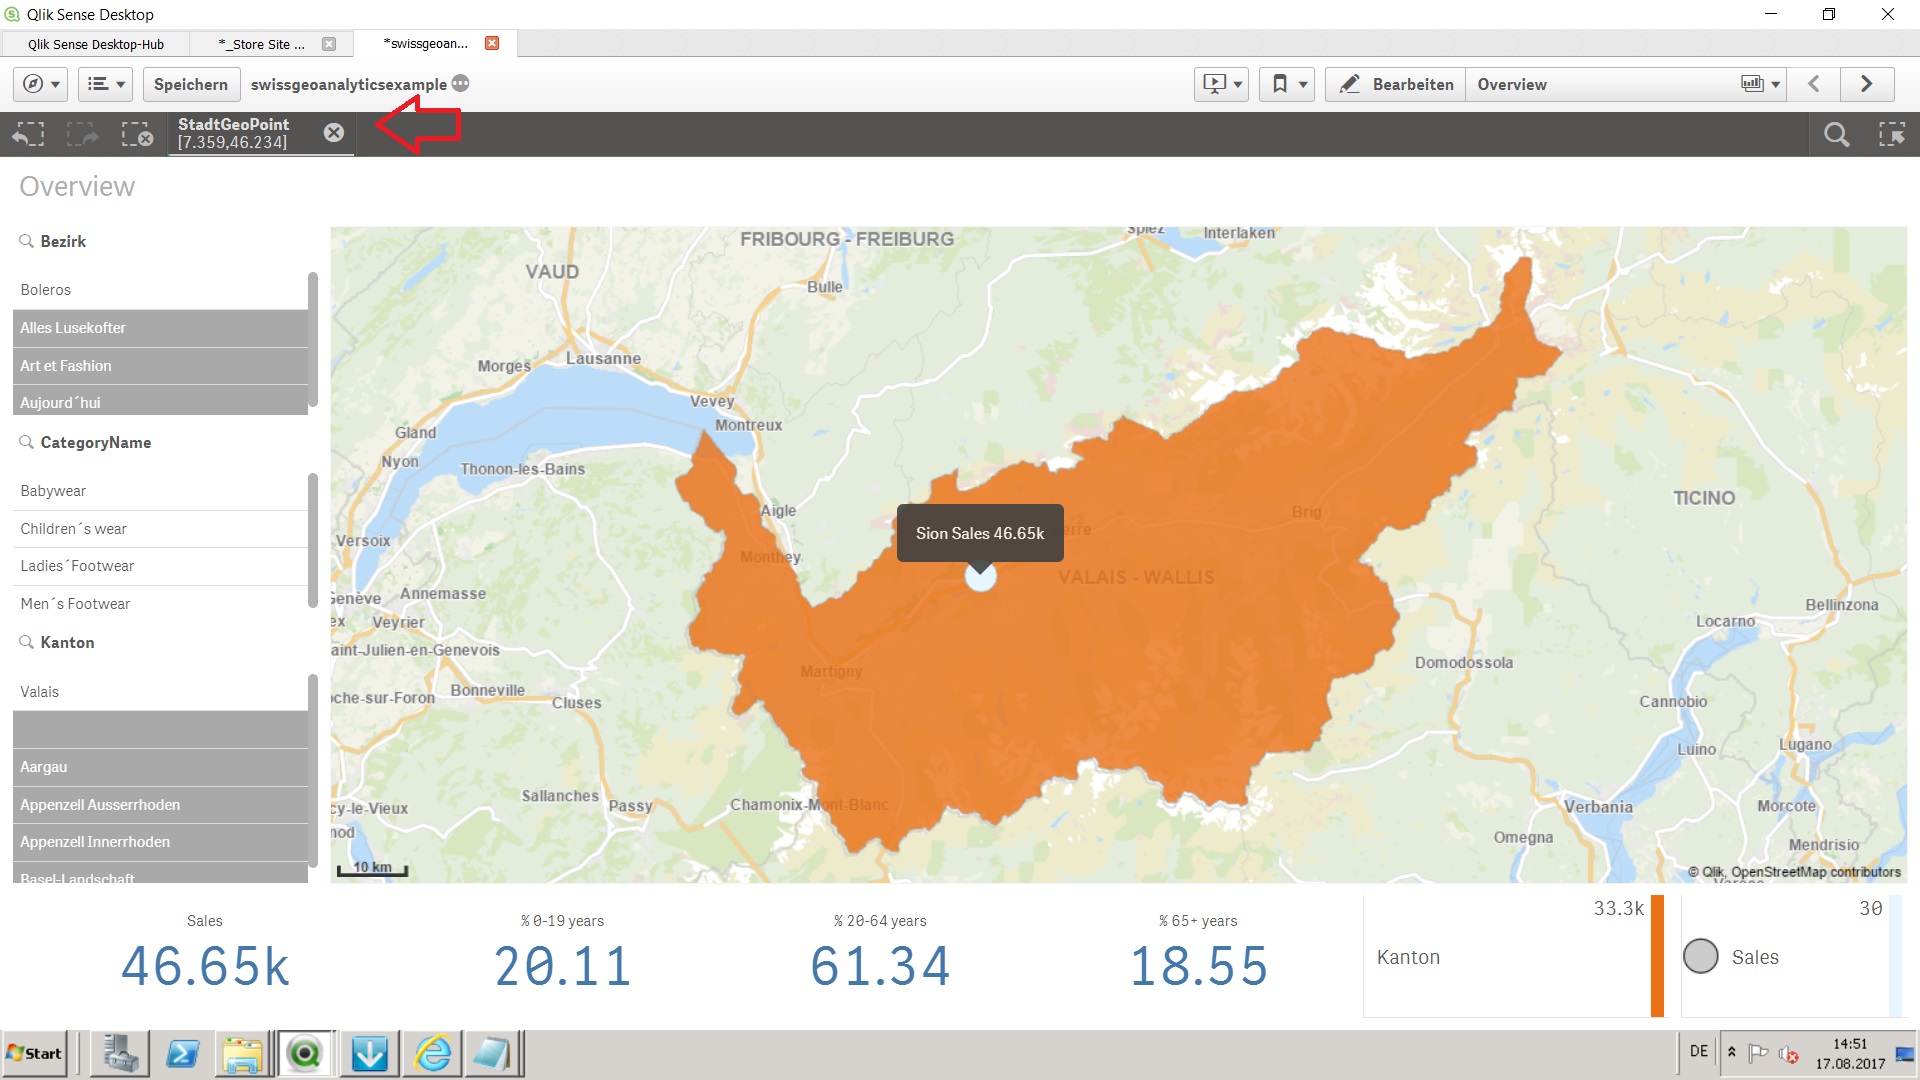
Thank you, this solves the problem of being able to limit which bubbles appear. Now my other problem is related to the fact that I had to download my own list of all Swiss cities and their Lat/lon. I've made geopoints for each city and I use the GeoPoints as the "locationID". I use the city name (also in my list) to ensure the fly-over bubble has the right label. Problem is, I need the "selected value", which appears in the upper left of the screen, to display the city name, not the GeoPoint. Just using the geoanalytics lookup feature does not work for many Swiss cities (even when the names are fully qualified as in the idevio users manual). (In this example, I've selected the city Sion, located in the Swiss canton of Valais)
- Mark as New
- Bookmark
- Subscribe
- Mute
- Subscribe to RSS Feed
- Permalink
- Report Inappropriate Content
Hi Pamela,
To get better hits, you can provide more information to the lookup service.
Do this either in the "Location Options" tab or directly i the location expression:
City names are ambiguous so it's good to add country code after the name. ='Sion, CH'
='Sion, CH:P*' to indicate it'sa city add the type.
To get nicer selection names, use the City name as the dimension and put the location info (GeoPoint) in the expression. QGA accepts location info either in the dimension or as a expression.
Thanks,
Patric
- Mark as New
- Bookmark
- Subscribe
- Mute
- Subscribe to RSS Feed
- Permalink
- Report Inappropriate Content
Hi Patric,
Thank you. Using the geopoint in the dimension worked for the city. Now the selection looks nicer.
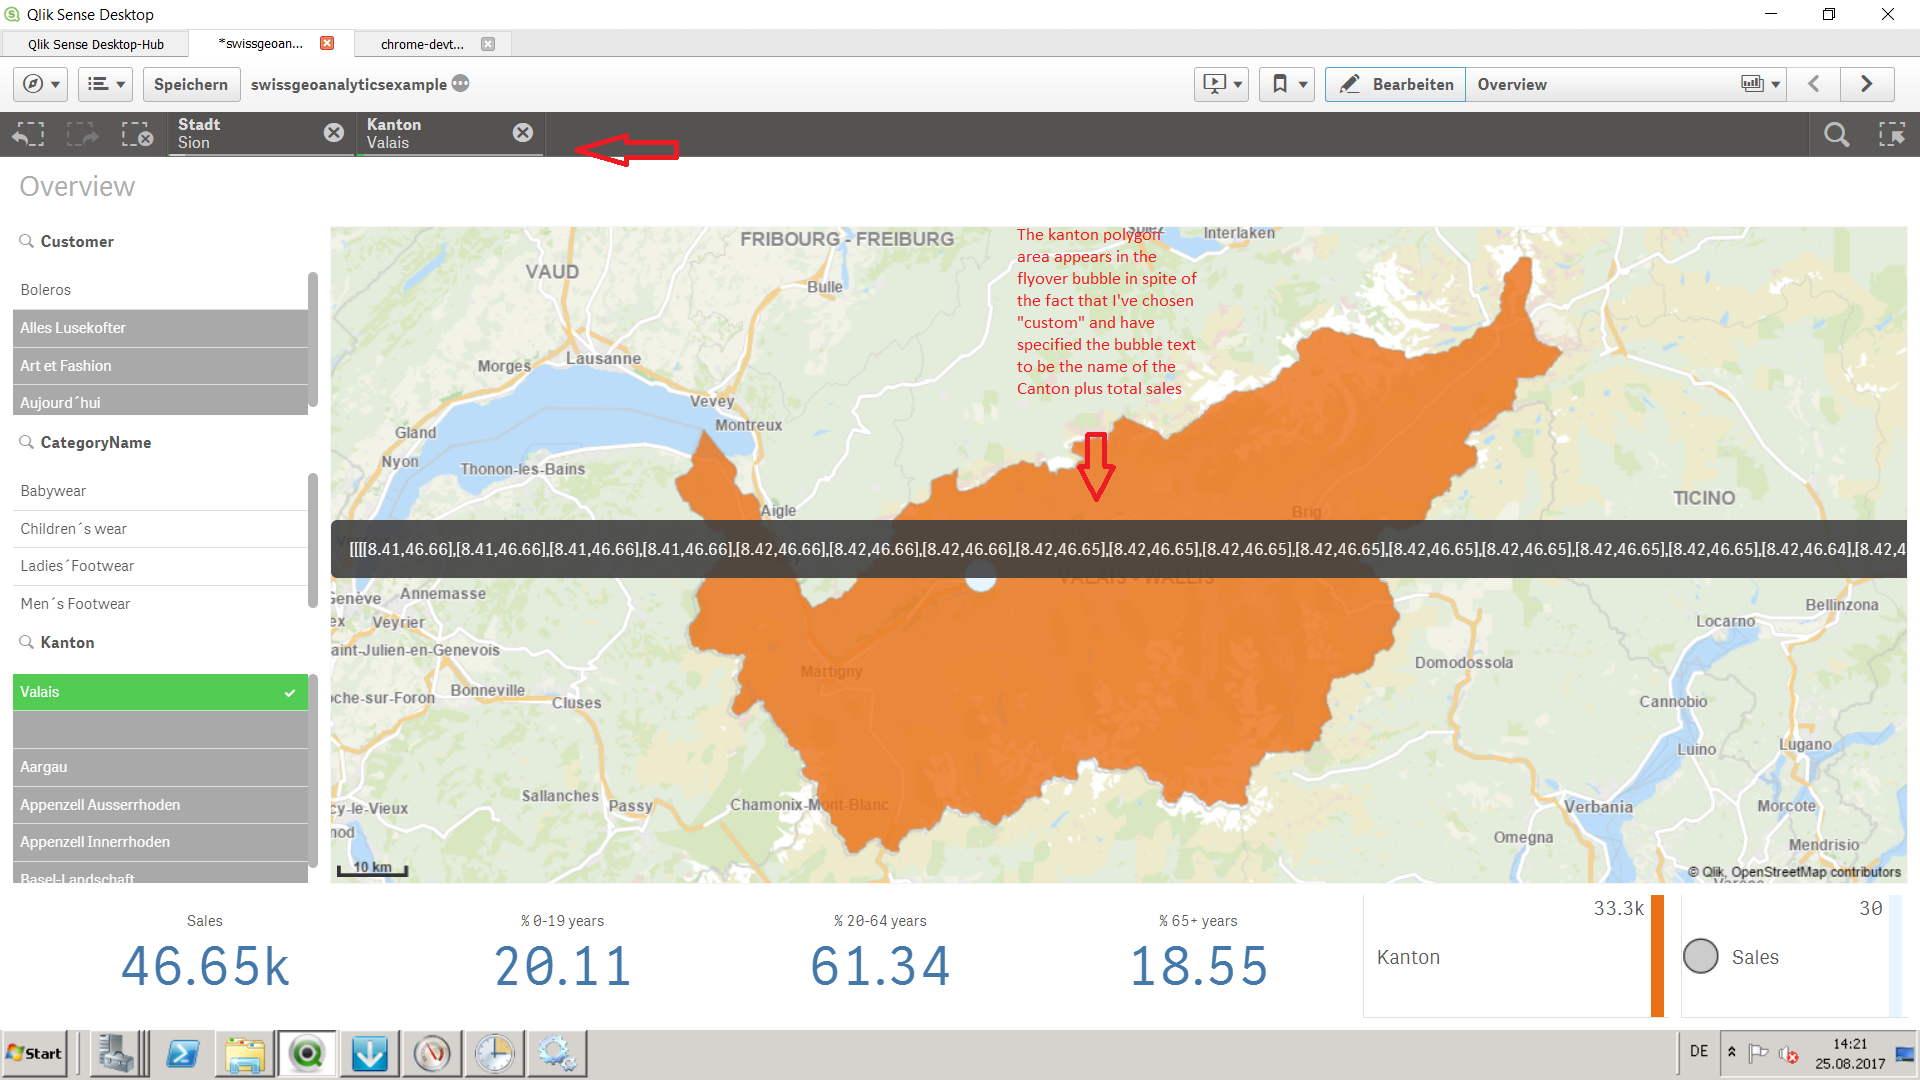
But when I do the same thing for my Canton (state) data, where I am using polygons that I downloaded because they are more accurate for admin areas 2 and 3 in Switzerland, the flyover bubble shows the polygon data instead of the name. This happens even when I've selected "custom" bubble and formula "Kanton&', Sales '&sum(Sales)". So the question is, how to get the selection display to look good in the selection bar, and the custom flyover bubble to work properly, when performing a drilldown through one or more polygon layers? Many thanks, Pam

- Mark as New
- Bookmark
- Subscribe
- Mute
- Subscribe to RSS Feed
- Permalink
- Report Inappropriate Content
Hi Pamela, You need to change the appearance of the Area Layer and add Custom Info Bubble with for example the formula you supplied. A layer needs a measure in order to display an info bubble when hoovering over the map/layer. You can make sure that the Location Source is correct under Location Option (Dimension/Measure). You can also change the draw order under Layer Options if you like to display your points in the same view.
BR,
Jonas