Unlock a world of possibilities! Login now and discover the exclusive benefits awaiting you.
- Qlik Community
- :
- All Forums
- :
- GeoAnalytics
- :
- GeoAnalytics | How to use images to plot on a grap...
- Subscribe to RSS Feed
- Mark Topic as New
- Mark Topic as Read
- Float this Topic for Current User
- Bookmark
- Subscribe
- Mute
- Printer Friendly Page
- Mark as New
- Bookmark
- Subscribe
- Mute
- Subscribe to RSS Feed
- Permalink
- Report Inappropriate Content
GeoAnalytics | How to use images to plot on a graph Dynamically
Hello,
Love the power and flexibility Of GeoAnalytics !
But I have a request that I hope you can answer.
My goal is to to optain that map (simplify version, I am more about the logic behind it) :
Raw data are :
| Year | Shark Attack |
| 2019 | 110 |
| 2020 | 200 |
| 2021 | 90 |
My goal is to have some flexibility to change the number of shark (but keeping the ratio) and change gap between axis So what I am looking for, if some trick exists to do it directly on the chart (in only one point layer), not on the script ? (with some repeat, pick, valueloop, valuelist or I don't know extacly what magic trick)
For the moment I can do that with some table create in the script part and a point layer. (see below) But I am looking for a more flexible way.
Script:
GeoMap:
Hope there is something to do it 🙂
Best,
Alex
Accepted Solutions
- Mark as New
- Bookmark
- Subscribe
- Mute
- Subscribe to RSS Feed
- Permalink
- Report Inappropriate Content
The number of points depends on the dimension for the layer. So convert the indata to one entry per image, in this case each image represent 10 attacks by the following in the load script.
sharks:
load * Inline [
Shark Year,Shark Attack
2019,110
2020,200
2021,90
];

Let vNooR = NoOfRows('sharks');
For i = 0 to (vNooR-1)
	Let vYear = Peek('Shark Year', $(i), 'sharks');
    Let vNrOfAttacks = Peek('Shark Attack', $(i), 'sharks');
    shark_graph:
    load '$(vYear)-' & recno() as "Shark Point", '$(vYear)' as "Shark Year", recno() as "Shark Row" AutoGenerate (1*$(vNrOfAttacks)/10);
Next
I used a similar approach in "Parliament diagram" in https://community.qlik.com/t5/Documents/Top-10-Viz-tips-part-III-QlikWorld-2020/ta-p/1679607
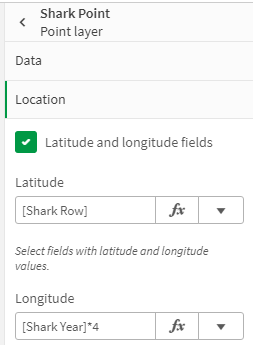
Then add a point layer with Shark Point as dimension, Location: Latitude [Shark Row] and Shark Year * 4 as Longitude. Base map "None" and User defined degrees as projection, modify the location to set offset and ratio.
Thanks,
Patric
- Mark as New
- Bookmark
- Subscribe
- Mute
- Subscribe to RSS Feed
- Permalink
- Report Inappropriate Content
Legendary anwser !
Thanks for the support. I start to really like Qlik for it's flexibility (coming from MS PowerBI)
Best,
Alex


