Unlock a world of possibilities! Login now and discover the exclusive benefits awaiting you.
Announcements
Now accepting applications for the Qlik Luminary and Partner Ambassador Programs: Apply by July 6!
- Qlik Community
- :
- Forums
- :
- Analytics & AI
- :
- Products & Topics
- :
- Integration, Extension & APIs
- :
- Qlik visualisation api color
Options
- Subscribe to RSS Feed
- Mark Topic as New
- Mark Topic as Read
- Float this Topic for Current User
- Bookmark
- Subscribe
- Mute
- Printer Friendly Page
Turn on suggestions
Auto-suggest helps you quickly narrow down your search results by suggesting possible matches as you type.
Showing results for
Contributor III
2017-03-02
09:22 AM
- Mark as New
- Bookmark
- Subscribe
- Mute
- Subscribe to RSS Feed
- Permalink
- Report Inappropriate Content
Qlik visualisation api color
Hi, i'm studying the capabilities of qlik visualisation trough javascript and i am having issues changing the color of the visualisation i created.
when working with mode: byDimenion and byMeasure everything works fine, but when using a singleColor or mode: byExpression it doesn't work.
Qliksense version: 3.2.1
QI engine: 12.2.1.1
here are two examples
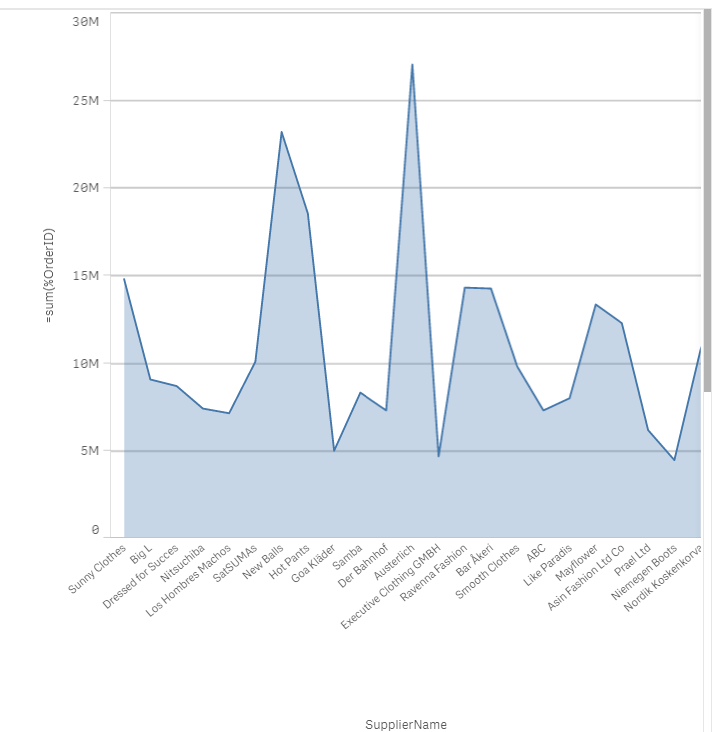
Mode: primary
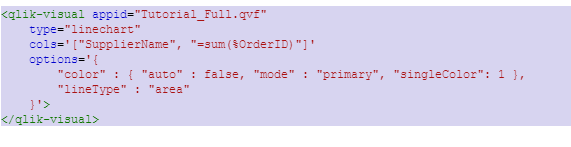
which outputs but should be red:
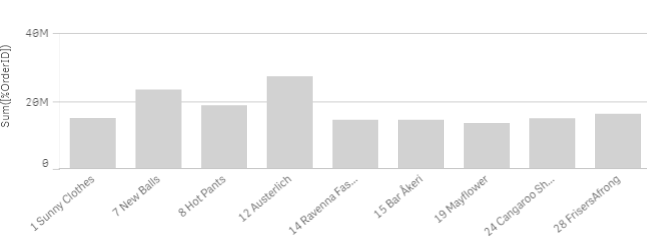
Mode: byExpression
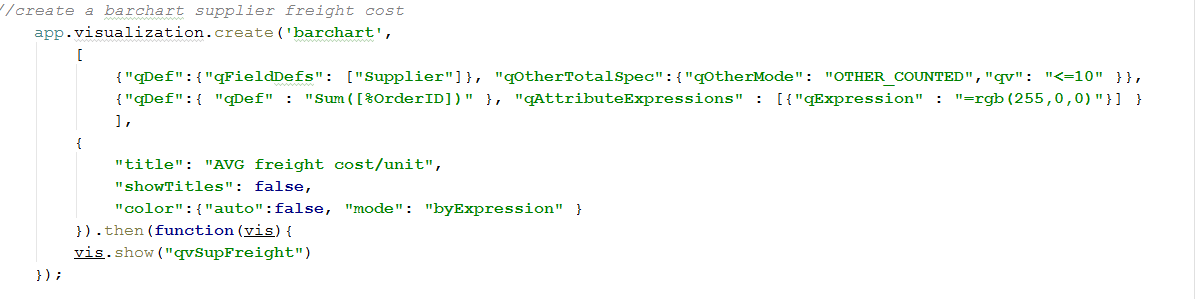
which outputs a gray chart instead of a red one
We already established that this is a bug in the qlik version as this al works normal in 2.1 but it doesn't on 3.2 can anyone else confirm this? or point out if i have done anything wrong.
739 Views
0 Replies