Unlock a world of possibilities! Login now and discover the exclusive benefits awaiting you.
- Qlik Community
- :
- Forums
- :
- Analytics & AI
- :
- Products & Topics
- :
- Integration, Extension & APIs
- :
- Show Duplicate value in dimension in qlik sense
- Subscribe to RSS Feed
- Mark Topic as New
- Mark Topic as Read
- Float this Topic for Current User
- Bookmark
- Subscribe
- Mute
- Printer Friendly Page
- Mark as New
- Bookmark
- Subscribe
- Mute
- Subscribe to RSS Feed
- Permalink
- Report Inappropriate Content
Show Duplicate value in dimension in qlik sense
Hello All,
I've a Purchase order table(EKPO of SAP) which also contain Price change of a material. Below is the Dummy Data
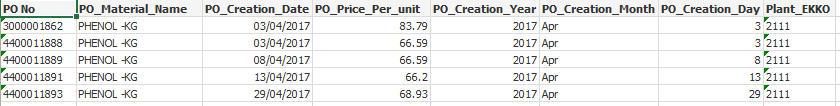
Now I have to show Price change(PO_Price_Per_Unit FIELD) Material wise. In dimension i've given drill down (Year ,Month,Day).
Points to note:-
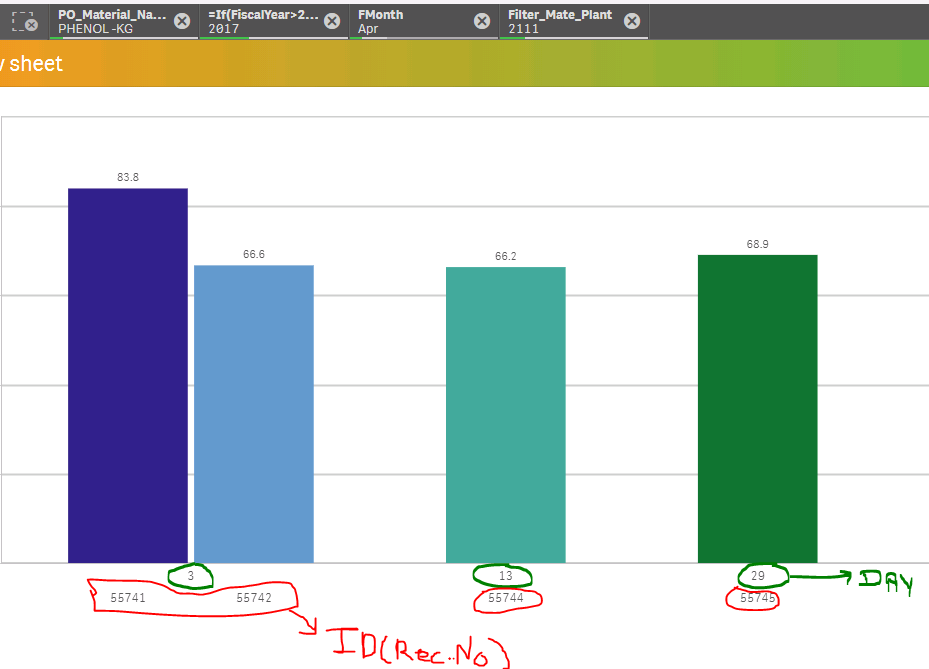
1- I've to show only those dates in which price is changed. Suppose on 03/04/2017 i created a PO and price was 83.79 and after few hours again for same material Price is 66.59 so i'll have to show two prices for 03/04/2017.
2- As you can see on 08/04/2017 new PO is created but Price is same as on 03/04/2017, So in Graph we'll not Consider 08/04/2017( For Solution of This problem I've created flag on Backend u can find the script below). In frontend i am considering only Flag={'1'}.
"if(PO_Material_Name= Peek(PO_Material_Name)and [Material Number]= Peek([Material Number])and Plant_EKKO= Peek(Plant_EKKO) and PO_Price_Per_unit= Peek(PO_Price_Per_unit),0,1) as Flag"
I Just want a solution how to show two Different value for date 03/04/2017.
P.S. I've USED recno() as ID in backend and in front end i took ID as a second dimension. this giving me correct data but chart is too heavy because of 10000+ Id number. So Please Suggest any other Solution.
Thanks in advance