Unlock a world of possibilities! Login now and discover the exclusive benefits awaiting you.
- Qlik Community
- :
- Forums
- :
- Analytics & AI
- :
- Products & Topics
- :
- Integration, Extension & APIs
- :
- Re: Variable value change according to dimension i...
- Subscribe to RSS Feed
- Mark Topic as New
- Mark Topic as Read
- Float this Topic for Current User
- Bookmark
- Subscribe
- Mute
- Printer Friendly Page
- Mark as New
- Bookmark
- Subscribe
- Mute
- Subscribe to RSS Feed
- Permalink
- Report Inappropriate Content
Variable value change according to dimension in set analysis
Hi,
I have Date, Membership signup date ,Customers and orders, I want the output where each customer before signup how many orders or after signup how much orders they are placed.
Each customer have their each signupdate.
For example-
| Cust | Date | SignUp date | orders |
| 1 | 2017-12-30 | 2017-10-30 | 0.49145 |
| 1 | 2017-12-12 | 2017-10-30 | 0.98633 |
| 1 | 2017-11-19 | 2017-10-30 | 0.32968 |
| 1 | 2017-11-16 | 2017-10-30 | 0.24649 |
| 1 | 2017-11-06 | 2017-10-30 | 0.19674 |
| 1 | 2017-11-06 | 2017-10-30 | 0.19695 |
| 1 | 2017-11-06 | 2017-10-30 | 0.19768 |
| 1 | 2017-11-06 | 2017-10-30 | 0.19798 |
| 1 | 2017-10-30 | 2017-10-30 | 0.33333 |
| 1 | 2017-10-07 | 2017-10-30 | 0.5 |
| 1 | 2017-03-25 | 2017-10-30 | 1 |
| 1 | 2017-02-23 | 2017-10-30 | 0 |
I want output sum(orders) before signup date 2017-10-30 and after signupdate, I have so many customers and having different signup date.
Thanks for help!
- « Previous Replies
-
- 1
- 2
- Next Replies »
Accepted Solutions
- Mark as New
- Bookmark
- Subscribe
- Mute
- Subscribe to RSS Feed
- Permalink
- Report Inappropriate Content
Hi Paridhi
As Sunny explained Set analysis is evaluated once per the chart so you have to turn to other thing for example here scripting if you want row wise implementation like this .
Please change the script. it will definitely work for you.
regards
Pradosh
- Mark as New
- Bookmark
- Subscribe
- Mute
- Subscribe to RSS Feed
- Permalink
- Report Inappropriate Content
May be create a flag in the script and then use the flag to determine before and after?
If(Date > SignUPdate, 'Before', 'After') as BeforeAfterFlag
Now use these expressions
Sum({<BeforeAfterFlag = {'Before'}>} order)
Sum({<BeforeAfterFlag = {'After'}>} order)
- Mark as New
- Bookmark
- Subscribe
- Mute
- Subscribe to RSS Feed
- Permalink
- Report Inappropriate Content
I don't want to change script , there is no way to do on dashboard only.
- Mark as New
- Bookmark
- Subscribe
- Mute
- Subscribe to RSS Feed
- Permalink
- Report Inappropriate Content
try this
sum({<Date={"<$(=date(max([SignUp date]),'YYYY-MM-DD'))"}>}orders)
sum({<Date={">=$(=date(max([SignUp date]),'YYYY-MM-DD'))"}>}orders)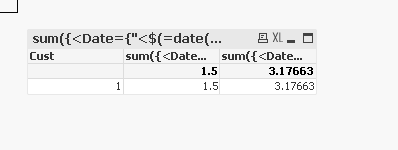
- Mark as New
- Bookmark
- Subscribe
- Mute
- Subscribe to RSS Feed
- Permalink
- Report Inappropriate Content
Each customer have their own signup date so it takes only min and max signup date from whole data model .
- Mark as New
- Bookmark
- Subscribe
- Mute
- Subscribe to RSS Feed
- Permalink
- Report Inappropriate Content
i have updated the app. check if this what you wanted ? if not than the expected output as per the data provided
- Mark as New
- Bookmark
- Subscribe
- Mute
- Subscribe to RSS Feed
- Permalink
- Report Inappropriate Content
Do you happen to have a OrderID field in your database which is associated with a single date? If not, then you might have to use Aggr() and if to get this working... I don't think there is a way to do this on the front end with just set analysis
- Mark as New
- Bookmark
- Subscribe
- Mute
- Subscribe to RSS Feed
- Permalink
- Report Inappropriate Content
Hi Sunny
If i am understanding the requirement correctly, the QVW i have posted is showing the right amount before and after . Can you please make me understand what i am missing here?
when i am using max([Signup date]) its showing different result for diff customer. Isn't what the OP wanted ?
- Mark as New
- Bookmark
- Subscribe
- Mute
- Subscribe to RSS Feed
- Permalink
- Report Inappropriate Content
I may be wrong, but when you use set analysis it is evaluated once per chart. For customer 3, the signup date is 2017-10-26, but the set analysis is still picking all order before 2017-10-30 for customer 3 also...
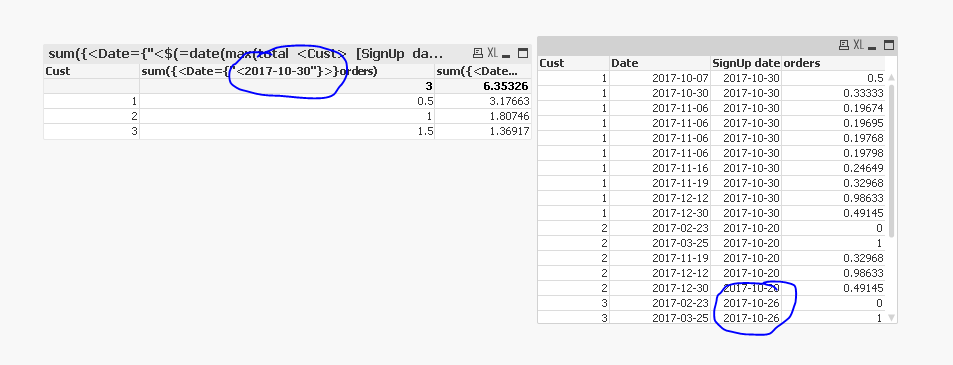
It happens that, in your sample there are no orders between 2017-10-26 and 2017-10-30, but if there were, then making selection in Customer 3 will change the numbers for Customer 3
- Mark as New
- Bookmark
- Subscribe
- Mute
- Subscribe to RSS Feed
- Permalink
- Report Inappropriate Content
I have added one more record for 3...
LOAD * INLINE [
Cust, Date, SignUp date, orders
1, 2017-12-30, 2017-10-30, 0.49145
1, 2017-12-12, 2017-10-30, 0.98633
1, 2017-11-19, 2017-10-30, 0.32968
1, 2017-11-16, 2017-10-30, 0.24649
1, 2017-11-06, 2017-10-30, 0.19674
1, 2017-11-06, 2017-10-30, 0.19695
1, 2017-11-06, 2017-10-30, 0.19768
1, 2017-11-06, 2017-10-30, 0.19798
1, 2017-10-30, 2017-10-30, 0.33333
1, 2017-10-07, 2017-10-30, 0.5
2, 2017-03-25, 2017-10-20, 1
2, 2017-02-23, 2017-10-20, 0
2, 2017-12-30, 2017-10-20, 0.49145
2, 2017-12-12, 2017-10-20, 0.98633
2, 2017-11-19, 2017-10-20, 0.32968
3, 2017-11-16, 2017-10-26, 0.24649
3, 2017-11-06, 2017-10-26, 0.19674
3, 2017-11-06, 2017-10-26, 0.19695
3, 2017-11-06, 2017-10-26, 0.19768
3, 2017-11-06, 2017-10-26, 0.19798
3, 2017-10-30, 2017-10-26, 0.33333
3, 2017-10-27, 2017-10-26, 0.54
3, 2017-10-07, 2017-10-26, 0.5
3, 2017-03-25, 2017-10-26, 1
3, 2017-02-23, 2017-10-26, 0
];
Now check the expression with and without selection in 3
- « Previous Replies
-
- 1
- 2
- Next Replies »