Unlock a world of possibilities! Login now and discover the exclusive benefits awaiting you.
- Qlik Community
- :
- Support
- :
- Support
- :
- Knowledge
- :
- Member Articles
- :
- How to use - Dimensionality()
- Edit Document
- Move Document
- Delete Document
- Subscribe to RSS Feed
- Mark as New
- Mark as Read
- Bookmark
- Subscribe
- Printer Friendly Page
- Report Inappropriate Content
How to use - Dimensionality()
- Move Document
- Delete Document and Replies
- Mark as New
- Bookmark
- Subscribe
- Mute
- Subscribe to RSS Feed
- Permalink
- Report Inappropriate Content
How to use - Dimensionality()
Definition:
Returns the number of dimension columns that have non-aggregation content. i.e. do not contain partial sums or collapsed aggregates.
A typical use is in attribute expressions, when you want to apply different cell formatting depending on aggregation level of data.
This function is only available in charts. For all chart types except pivot table it will return the number of dimensions in all rows except the total, which will be 0.
What does it mean?
We have Table with 4 dimensions(columns): Product,Category,Type,Sales
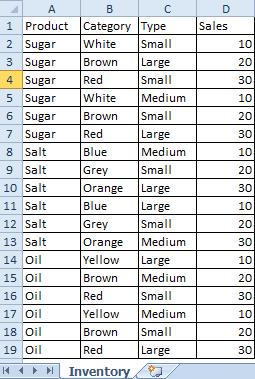 |
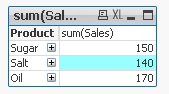
Now we want to create Pivot Table by using those Dimensions.
We are going to use only 3 of them(Product,Category,Type) and use 4th(Sales) in our expression.
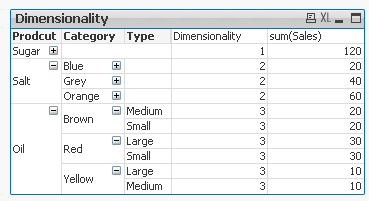
The result is shown below:
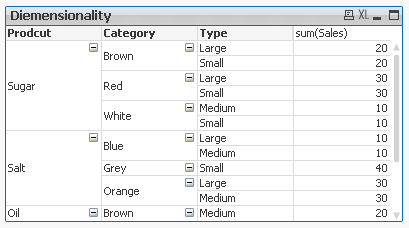
This Pivot Table has 3 dimensions so its maximum dimensionality is 3.
For better understating please see table below.
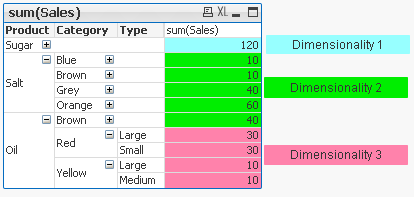
The function is used to show on which dimensionality level each of the Pivot Table row is:
 |

'Sugar' has dimensionality of 1 which is Total for that 'Product'.
'Salt' has dimensionality of 2 which is Total for each 'Category' of that 'Product'.
'Oil' has dimensionality of 3 which is single value for each 'Type' of the 'Product's' 'Category'.
So then more Dimension we use the greater dimensionality of our Pivot Table is.
Practical use:
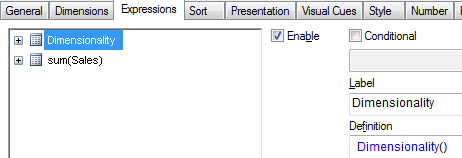
1) To show the level of dimensionality:
Expression:
if(Dimensionality()=1 ,RGB(151,255,255),if(Dimensionality()=2 ,RGB(0,238,0),if(Dimensionality()=3,RGB(255,130,171))))
 |
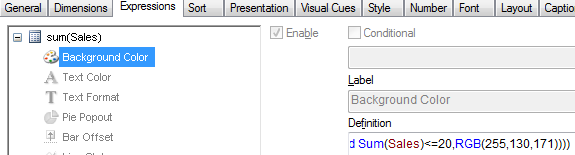
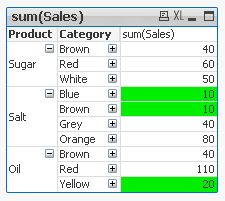
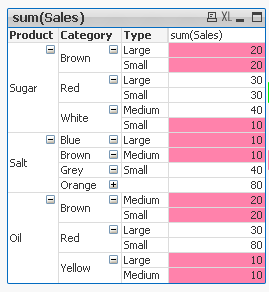
2) Highlight background of rows which on each level fall into certain condition:
Expression:
if(Dimensionality()=1 and sum(Sales)<150,RGB(151,255,255),if(Dimensionality()=2 and sum(Sales)<=20,RGB(0,238,0),if(Dimensionality()=3 and Sum(Sales)<=20,RGB(255,130,171))))
| LEVEL1 --> Values <140 | LEVEL 2 --> Values <=20 | LEVEL 3 --> Values <=20 |
|---|---|---|
 |  |  |
Remember ![]()
- To use the script below the Excel file must be saved in the same folder that your qvd file
Otherwise you will need to make changes the this path - [Dimensionality.xlsx]
Directory;
LOAD Product,
Category,
Type,
Sales
FROM
[Dimensionality.xlsx]
(ooxml, embedded labels, table is Sheet1);
Felling Qlingry?
- Move Comment
- Delete Comment
- Mark as Read
- Mark as New
- Bookmark
- Permalink
- Report Inappropriate Content
Are you referring to this table?
Sugar is the only column (dimension)in this section.
In Qlik Dimension=Column
- Move Comment
- Delete Comment
- Mark as Read
- Mark as New
- Bookmark
- Permalink
- Report Inappropriate Content
yes this table
- Move Comment
- Delete Comment
- Mark as Read
- Mark as New
- Bookmark
- Permalink
- Report Inappropriate Content
So have I answered your question as you wanted?
- Move Comment
- Delete Comment
- Mark as Read
- Mark as New
- Bookmark
- Permalink
- Report Inappropriate Content
Very helpful post! Can you also explain the difference between Dimensionality and the SecondaryDimensionality and specific usage of the same! Thanks in advance!
Thanks,
DJ
- Move Comment
- Delete Comment
- Mark as Read
- Mark as New
- Bookmark
- Permalink
- Report Inappropriate Content
Secondary Dimensionality is being used for Horizontal dimensions
See here:
The second dimension... or how to use secondarydimensionality()
Still feeling Qlikngry?
- Move Comment
- Delete Comment
- Mark as Read
- Mark as New
- Bookmark
- Permalink
- Report Inappropriate Content
Very nice... (y)
- Move Comment
- Delete Comment
- Mark as Read
- Mark as New
- Bookmark
- Permalink
- Report Inappropriate Content
awesome..
- Move Comment
- Delete Comment
- Mark as Read
- Mark as New
- Bookmark
- Permalink
- Report Inappropriate Content
Very Helpful...
Thanks,
Hirish
- Move Comment
- Delete Comment
- Mark as Read
- Mark as New
- Bookmark
- Permalink
- Report Inappropriate Content
Hi Robert,
Is there a way the sub totals for the different dimensions get there name before the "total" label.
Like Product Total
Category Total
Type Total
- Move Comment
- Delete Comment
- Mark as Read
- Mark as New
- Bookmark
- Permalink
- Report Inappropriate Content
Practical post that I would recommend reading for everybody.