Unlock a world of possibilities! Login now and discover the exclusive benefits awaiting you.
- Qlik Community
- :
- Support
- :
- Support
- :
- Knowledge
- :
- Member Articles
- :
- The second dimension... or how to use secondarydim...
- Move Document
- Delete Document
- Subscribe to RSS Feed
- Mark as New
- Mark as Read
- Bookmark
- Subscribe
- Printer Friendly Page
- Report Inappropriate Content
The second dimension... or how to use secondarydimensionality()
- Move Document
- Delete Document and Replies
- Mark as New
- Bookmark
- Subscribe
- Mute
- Subscribe to RSS Feed
- Permalink
- Report Inappropriate Content
The second dimension... or how to use secondarydimensionality()
Prologue...
Firstly I would like to say that probably it would be easier to call this function Horizontal Dimensionality (or HDim or even SecDim)
This could clear some clouds - when you first see this function you may feel that this another level for dimensionality function.
(for those who wants to know more about the dimensionality function please see this document
What it is used for?
Returns the number of dimension pivot table rows that have non-aggregation content. i.e. do not contain partial sums or collapsed aggregates. This function is the equivalent of the dimensionality function for horizontal pivot table dimensions.
The secondarydimensionality() function always returns 0 when used outside of pivot tables.
What does it mean?
Where dimensionality shows number of vertical dimensions, secondarydimensionality shows number of horizontal dimensions.
Lets take our sample data.
 |
We have four dimensions(columns):
Product,Category,Type and Sales.
Each Product have 2 Categories
Each Category can have up to 3 Types
Let's create Pivot Table using 3 of those Dimension Product,Category and Type and use Sales as our Expression.
 |
This Pivot Table has 3 dimensions so its maximum dimensionality is 3.
'Sugar' has dimensionality of 1 which is Total for that 'Product'.
'Salt' has dimensionality of 2 which is Total for each 'Category' of that 'Product'.
'Oil' has dimensionality of 3 which is single value for each 'Type' of the 'Product's' 'Category'
So in few words : secondarydimensionality (and dimensionality) is the number of dimensions used in a Table
For better understating please see table below:
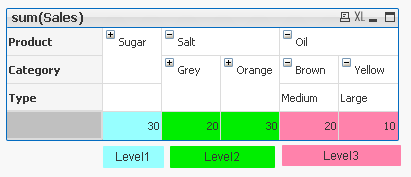
The function is used to show on which dimensionality level each of the Pivot Table row is:
 |
Practical use:
1) To show the level of dimensionality:

Expression:
if(secondaryDimensionality()=1,RGB(151,255,255),if(secondaryDimensionality()=2,RGB(0,238,0),
if(secondaryDimensionality()=3,RGB(255,130,171))))

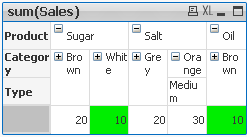
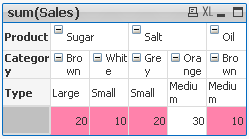
2) Highlight background of rows which on each level fall into certain condition:
Expression:
if(Dimensionality()=1 and sum(Sales)<150,RGB(151,255,255),if(Dimensionality()=2 and sum(Sales)<=20,RGB(0,238,0),if(Dimensionality()=3 and Sum(Sales)<=20,RGB(255,130,171))))
| LEVEL 1 --> Values <35 | LEVEL 2 --> Values <=15 | LEVEL 3 --> Values <=20 |
|---|---|---|
 |  |  |
- To use the script below the Excel file must be saved in the same folder that your qvd file
Otherwise you will need to make changes the this path - secondarydimensionality.xlsx
Directory;
LOAD Product,
Category,
Type,
Sales
FROM
secondarydimensionality.xlsx
(ooxml, embedded labels, table is Sheet1);
Still feeling hungry?
Do you Qualify?- How to use QUALIFY statement
Missing Manual - GetFieldSelections() + Bonus Example
MaxString & MinString - How to + examples
The second dimension... or how to use secondarydimensionality()
- Move Comment
- Delete Comment
- Mark as Read
- Mark as New
- Bookmark
- Permalink
- Report Inappropriate Content
Tricky to understand,but got it finally. Thanks Robert_Mika again as always!
- Move Comment
- Delete Comment
- Mark as Read
- Mark as New
- Bookmark
- Permalink
- Report Inappropriate Content
You are welcome.
- Move Comment
- Delete Comment
- Mark as Read
- Mark as New
- Bookmark
- Permalink
- Report Inappropriate Content
Never a day, I don't learn something new about Qlikview. Thanks for sharing Robert.
- Move Comment
- Delete Comment
- Mark as Read
- Mark as New
- Bookmark
- Permalink
- Report Inappropriate Content
Nice document with examples ![]()
- Move Comment
- Delete Comment
- Mark as Read
- Mark as New
- Bookmark
- Permalink
- Report Inappropriate Content
Another use case of secondarydimensionality() Function:
:
- Move Comment
- Delete Comment
- Mark as Read
- Mark as New
- Bookmark
- Permalink
- Report Inappropriate Content
Another good use of function
- Move Comment
- Delete Comment
- Mark as Read
- Mark as New
- Bookmark
- Permalink
- Report Inappropriate Content
Good analysis, I suggest look dimentionality() , given link in the present document to better understand
secondarydimensionality().
Reagards
Pavan N
- Move Comment
- Delete Comment
- Mark as Read
- Mark as New
- Bookmark
- Permalink
- Report Inappropriate Content
Excellent article, Robert, but I couldn't resist of removing the following categories that it shouldn't belong to. Just for keeping their contents as clean as possible.
Deployment
Developer Toolkit
Direct Discovery
Integration
Management