Unlock a world of possibilities! Login now and discover the exclusive benefits awaiting you.
- Qlik Community
- :
- All Forums
- :
- Visualization and Usability
- :
- Re: Color by Expression - Line Chart and Pie Chart
- Subscribe to RSS Feed
- Mark Topic as New
- Mark Topic as Read
- Float this Topic for Current User
- Bookmark
- Subscribe
- Mute
- Printer Friendly Page
- Mark as New
- Bookmark
- Subscribe
- Mute
- Subscribe to RSS Feed
- Permalink
- Report Inappropriate Content
Color by Expression - Line Chart and Pie Chart
Hello,
I have a line chart and a bar chart in which I want to use the same expression to color.
Below is the expression and a screen shot of the two charts.
Is there a reason that they pie chart colors wouldn't work?
IF([Code] = '91'
,red()
,IF ([Code] = '83'
,blue()
,If(
= '84'
,yellow()
,green()
)
)
)

- Mark as New
- Bookmark
- Subscribe
- Mute
- Subscribe to RSS Feed
- Permalink
- Report Inappropriate Content
I'm using June 2017 version and it works fine using both RGB and colors.
Did you select color by expression and checked "The expression is a color code" in "Color and legend" settings ?
- Mark as New
- Bookmark
- Subscribe
- Mute
- Subscribe to RSS Feed
- Permalink
- Report Inappropriate Content
Yes, that option is selected.
- Mark as New
- Bookmark
- Subscribe
- Mute
- Subscribe to RSS Feed
- Permalink
- Report Inappropriate Content
Hi hlines_usacs,
Can you please share the dimension and measure that you are using.
Regards,
Rajesh Thakur
- Mark as New
- Bookmark
- Subscribe
- Mute
- Subscribe to RSS Feed
- Permalink
- Report Inappropriate Content
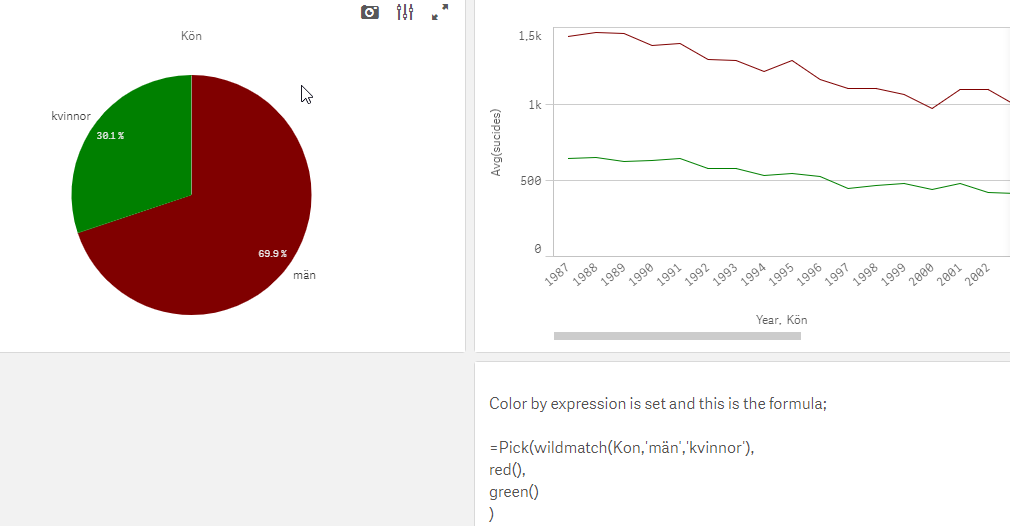
An example from 3.2 SR4;
- Mark as New
- Bookmark
- Subscribe
- Mute
- Subscribe to RSS Feed
- Permalink
- Report Inappropriate Content
Do you have anything else in that Dimension except Number.
Because in screenshot something is blurred before numbers
- Mark as New
- Bookmark
- Subscribe
- Mute
- Subscribe to RSS Feed
- Permalink
- Report Inappropriate Content
They are string values.
- Mark as New
- Bookmark
- Subscribe
- Mute
- Subscribe to RSS Feed
- Permalink
- Report Inappropriate Content
did you use those actual values while comparing with Code field ?
- Mark as New
- Bookmark
- Subscribe
- Mute
- Subscribe to RSS Feed
- Permalink
- Report Inappropriate Content
it seems to me like there is something wrong with where you are applying the expression. you need to check your measure too and make sure you use that back ground color of the dimension/expression. if possible share a sample document.
- Mark as New
- Bookmark
- Subscribe
- Mute
- Subscribe to RSS Feed
- Permalink
- Report Inappropriate Content
This is the measure I am using.
SUM({<[Fact Type]={'Financial'},[Code]={'91','85','84','83'}>}[Encounters])
- Mark as New
- Bookmark
- Subscribe
- Mute
- Subscribe to RSS Feed
- Permalink
- Report Inappropriate Content
Dimension:
[Code]
Measure:
SUM({<[Fact Type]={'Financial'},[Code]={'91','85','84','83'}>}[Encounters])