Unlock a world of possibilities! Login now and discover the exclusive benefits awaiting you.
- Qlik Community
- :
- All Forums
- :
- Visualization and Usability
- :
- Re: How to disable Pie chart Labels?
- Subscribe to RSS Feed
- Mark Topic as New
- Mark Topic as Read
- Float this Topic for Current User
- Bookmark
- Subscribe
- Mute
- Printer Friendly Page
- Mark as New
- Bookmark
- Subscribe
- Mute
- Subscribe to RSS Feed
- Permalink
- Report Inappropriate Content
How to disable Pie chart Labels?
Hi,
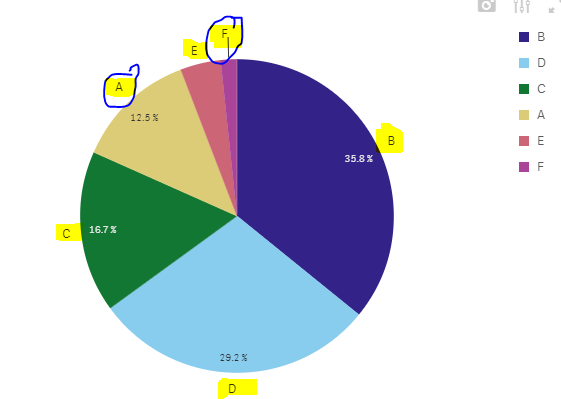
I have created following sample pie chart in Qlik sense. This shows labels as well as legend. I want to get rid off highlighted labels and show only legend.

Can this be done in Qlik sense?
Or is there any extension which I can use?
- « Previous Replies
-
- 1
- 2
- Next Replies »
- Mark as New
- Bookmark
- Subscribe
- Mute
- Subscribe to RSS Feed
- Permalink
- Report Inappropriate Content
The Highlighted Labels are dimension values and you cannot remove them in Qliksense
The legend is dependent on Dimension values.
Hope this helped you. Thanks
- Mark as New
- Bookmark
- Subscribe
- Mute
- Subscribe to RSS Feed
- Permalink
- Report Inappropriate Content
Thank you. Yes, seems so. But it is duplication of information.
As labels are not displayed properly when its comes to more dimension values, I want to use legend.
Is there any extension available for this?
- Mark as New
- Bookmark
- Subscribe
- Mute
- Subscribe to RSS Feed
- Permalink
- Report Inappropriate Content
Usually with Pie charts when you have more Dimensions.
The dimension values wont be displayed properly, you can limit the dimension values or adjust the grid size.
- Mark as New
- Bookmark
- Subscribe
- Mute
- Subscribe to RSS Feed
- Permalink
- Report Inappropriate Content
Don't forget !
When applicable please mark the appropriate replies as CORRECT https://community.qlik.com/docs/DOC-14806. This will help community members and Qlik Employees know which discussions have already been addressed and have a possible known solution. Please mark threads as HELPFUL if the provided solution is helpful to the problem, but does not necessarily solve the indicated problem. You can mark multiple threads as HELPFUL if you feel additional info is useful to others.
- Mark as New
- Bookmark
- Subscribe
- Mute
- Subscribe to RSS Feed
- Permalink
- Report Inappropriate Content
We are in 2020 and this issue still exists.
The Pie chart will be more tidy and neat with the info just in the Legend
- Mark as New
- Bookmark
- Subscribe
- Mute
- Subscribe to RSS Feed
- Permalink
- Report Inappropriate Content
I agree, this should have been addressed already and solved
- Mark as New
- Bookmark
- Subscribe
- Mute
- Subscribe to RSS Feed
- Permalink
- Report Inappropriate Content
2021 and still no solution for what should be a very easy adjustment.
- Mark as New
- Bookmark
- Subscribe
- Mute
- Subscribe to RSS Feed
- Permalink
- Report Inappropriate Content
A suggestion has been made on the Ideas forum, maybe if we show some support we'll get it before 2025!
https://community.qlik.com/t5/Suggest-an-Idea/Hide-lables-in-pie-charts/idi-p/1719941
- Mark as New
- Bookmark
- Subscribe
- Mute
- Subscribe to RSS Feed
- Permalink
- Report Inappropriate Content
As a workaround, I have colored Dimension value label similar to the background of the sheet
- « Previous Replies
-
- 1
- 2
- Next Replies »

