Unlock a world of possibilities! Login now and discover the exclusive benefits awaiting you.
- Qlik Community
- :
- Support
- :
- Support
- :
- Knowledge
- :
- Support Articles
- :
- Tracing records with breakpoints
- Subscribe to RSS Feed
- Mark as New
- Mark as Read
- Bookmark
- Subscribe
- Printer Friendly Page
- Report Inappropriate Content
Tracing records with breakpoints
- Mark as New
- Bookmark
- Subscribe
- Mute
- Subscribe to RSS Feed
- Permalink
- Report Inappropriate Content
Tracing records with breakpoints
Overview
Talend Studio is an IDE based on Eclipse RCP. It provides a proprietary record trace debugger and allows you to run Talend Jobs in Trace mode and in Debug mode, to set a breakpoint on a data flow, and to trace records.
Environment
This procedure is compatible with all versions of Talend Data Integration (subscription only).
Procedure
Create an example Job
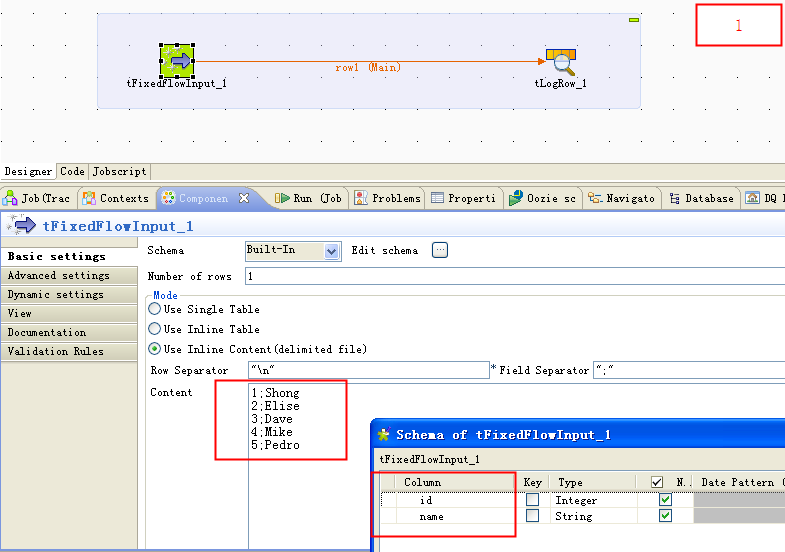
Create an example Job called TraceRecordsWithBreakpoint. Use a tFixedFlowInput to generate some source data such as:
1;Shong
2;Elise
3;Dave
4;Mike
5;Pedro
The detailed Job settings are shown in the following figure:
Set a breakpoint
To set a breakpoint on the data flow, proceed as follows:
-
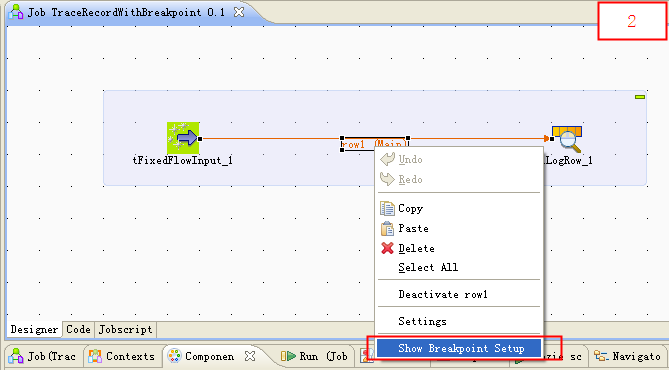
Right-click the connector between two components and select Show Breakpoint Setup.
Note: This feature is available only in Talend Data Integration (on subscription only).
-
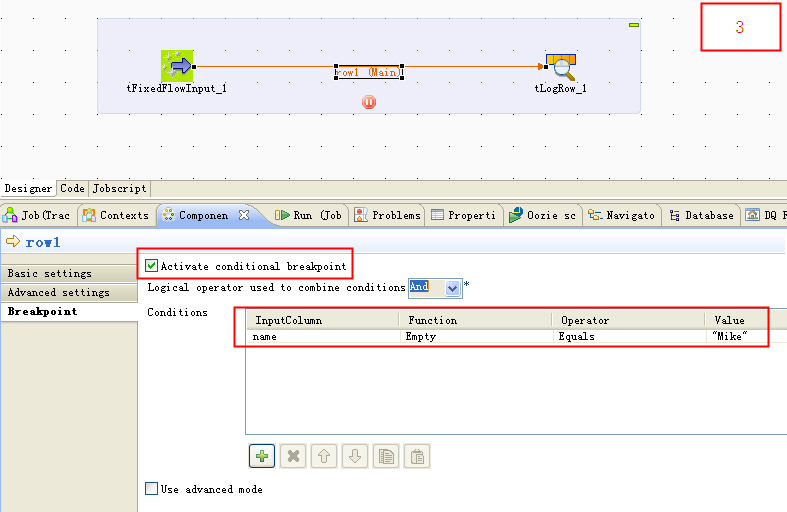
In the Breakpoint tab, check Active conditional breakpoint and/or Use advanced mode to set a breakpoint. In this example, if you check Active conditional breakpoint and set a breakpoint in the Condition table, the Job will pause when the value of the Name column equals Mike.
Trace records with breakpoint
Now run the Job in Traces Debug mode and trace records. Follow these steps:
-
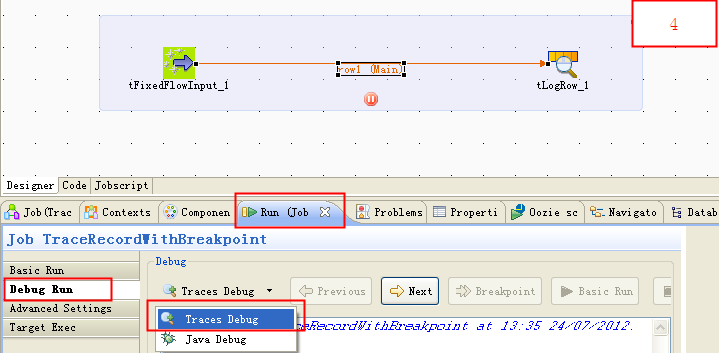
In the Run view, click Debug Run tab, select Traces Debug from the Debug list, and click Traces Debug to run the Job.
-
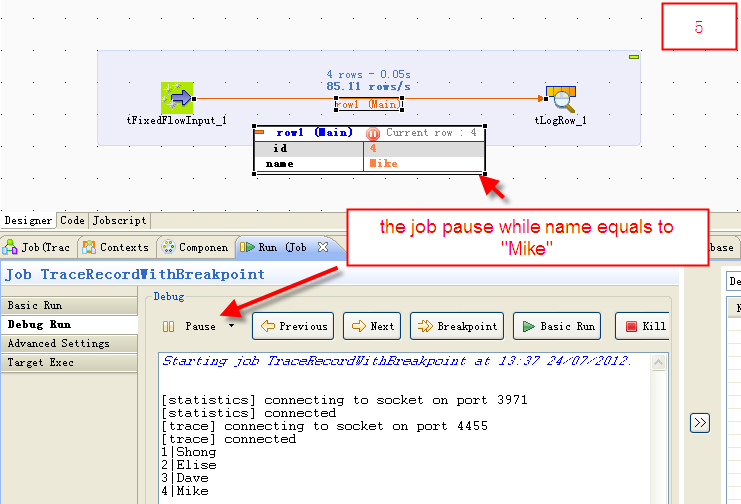
As the figure shows, the Job pauses when the value of the Name column equals Mike, when it matches the condition of the breakpoint.
Result
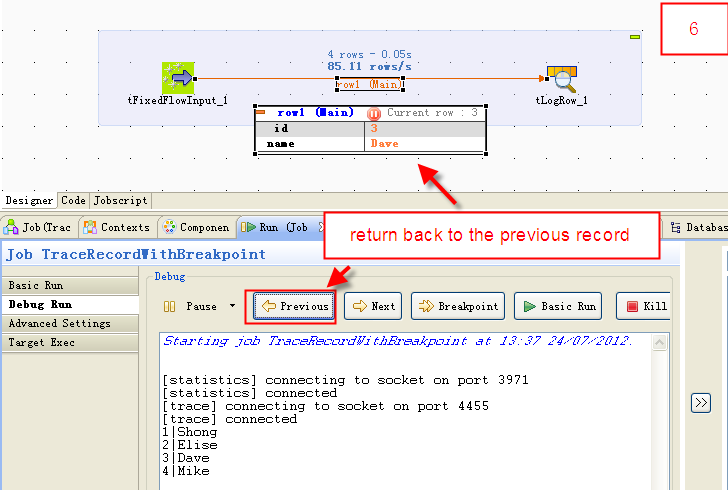
Now you can trace the records by clicking Previous, Next, and Breakpoint.
- Previous: return back to the previous record.
- Next: go to the next record.
- Breakpoint: continue to run and pause until next breakpoint.
- Basic Run: continue to run until ends.
- Kill: kill the Job.
