Unlock a world of possibilities! Login now and discover the exclusive benefits awaiting you.
- Qlik Community
- :
- Discover
- :
- Blogs
- :
- Product
- :
- Product Innovation
- :
- Qlik Sense May 2023 (Client-Managed) now available...
- Subscribe to RSS Feed
- Mark as New
- Mark as Read
- Bookmark
- Subscribe
- Printer Friendly Page
- Report Inappropriate Content
In this release, you will find the following new capabilities, many of which are already available in Qlik Cloud today:
Visualizations & Dashboards:
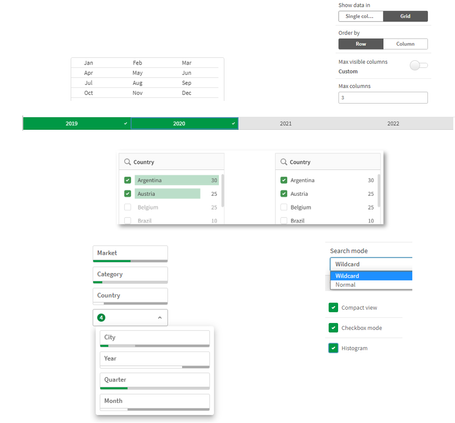
New Filter Pane
The new Filter Pane is a highly requested feature improvement. Like the List Box from QlikView, the new Filter pane includes a grid layout. It also provides several new capabilities, including grid mode, search mode (with wildcard option), checkbox mode, compact view, and histogram.
Table Exploration Menu
One of the most significant updates of the year, the new Straight Table significantly boosts self service capabilities with expanded exploratory analysis and reporting. It acts as a catch-all table, providing users with the flexibility to pick and choose how they would like their layout presented. Users can add many fields simultaneously, alternate dimensions and measures, customize column width, view the user field picker, choose pagination or virtual scroll, and store the layout in bookmarks.
New Background Options for Charts
We continue to roll out additional capabilities that add flexibility and customization to Qlik Sense Saas visualizations, you can now include backgrounds in bar charts with the option to set an image or color.
Increased number of visible lines within line chart art
Based on customer feedback, we have extended the number of data points that can be shown on the Line Chart. This gives users more flexibility and scalability within the Line Chart.
New Styling Panels
Provides flexibility, allowing customers to conform to company, department, or personal style standards and preferences. The styling panel for Text and Image covers titles, subtitles, and footnotes, and includes options for font size, color, and family.
New Axis and Value Label Styling for select charts
Styling for Bar Chart, Pie Chart, Combo Chart, and Scatter Plot has been enhanced to include axis title, axis labels, and value labels. These improvements add flexibility for customers, allowing them to conform to company, department, or personal style standards and preferences.
New Chart Hover and Selection Menu Design
Providing better customization, we have re-designed the chart hover and selection, enhancing chart rendering with new visual styling options.
Advanced Authoring:
New Engine Function
Working within the Qlik Engine object hierarchy, the new GetObjectld() chart function allows you to set a variable with sheet ID and a sheet action, automating the retrieval of the current sheet ID. This simplifies the creation of custom navigation, currently a tedious process. This feature was highly requested by customers.
Connectivity:
OAuth support for Databricks via MS Azure
The Qlik Databricks connector in Qlik Sense now supports the OAuth authentication option. This option will allow a Qlik Sense user to authenticate with Data bricks in the most secure way using OAuth 2.0. The support for OAuth also allows single sign-on (SSO) to Data bricks with Qlik Sense Saas when using an identity provider. This release only supports OAuth authentication with Databricks on Azure, but we plan to expand this capability to the other cloud platforms we support with Databricks in the future.
Google Analytics 4 Connector
The Google Analytics 4 connector extracts traffic and engagement metrics from your Google Analytics 4- enabled websites and apps and loads that data into your Qlik Sense apps.
Google is replacing Universal Analytics with Google Analytics 4. For more information about this change, see Google Analytics Help.
New authentication methods for Azure SQL database and Azure Synapse Analytics connectors
- The Azure SQL database and Azure Synapse Analytics connectors now support two new authentication methods:
- Azure OAuth: Allows single sign-on (SSO) when using an identity provider.
- Azure Active Directory: Protects user identity and simplifies the sign-in experience.
You must be a registered user to add a comment. If you've already registered, sign in. Otherwise, register and sign in.


