Unlock a world of possibilities! Login now and discover the exclusive benefits awaiting you.
- Qlik Community
- :
- Discover
- :
- Programs
- :
- Education
- :
- Qlik Education Documents
- :
- Qlikview adhoc dimension analisys [My own example]
- Subscribe to RSS Feed
- Mark as New
- Mark as Read
- Bookmark
- Subscribe
- Printer Friendly Page
- Report Inappropriate Content
Qlikview adhoc dimension analisys [My own example]
- Mark as New
- Bookmark
- Subscribe
- Mute
- Subscribe to RSS Feed
- Permalink
- Report Inappropriate Content
Qlikview adhoc dimension analisys [My own example]
Hi everybody,
I've been demanded recently customizable reports in Qlikview 11 and a way to accomplish this requirement was to let the users explore and design their own reports by adding or hiding columns and expressions.
I just wanted to share with everybody a simple example in which by loading inle sample dummy data we can create an small testing table and a chart which is using this Qlikview feature. Let's review it step by step :
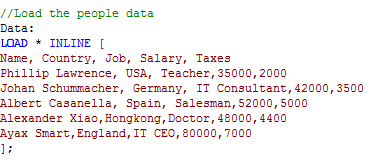
1. Create an inline sample table with 3 or 4 dimensions and a couple of expressions:

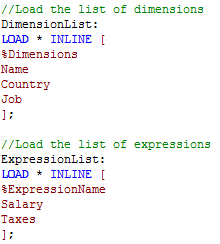
2. Let's create now 2 data island in our model, those with contain all dimension names and expression names each data island.

3. Now we have all the data model built in our QVW. The idea here is to create a straight table containig the dimensions and expressions of the Data table and let the user select which ones will be displayed. Once we have the table created with our dimensions and our expressions we will need to put the following conditions:
Alt( WildMatch ( GetFieldSelections(%Dimensions,'|'), '*DIMENSION_NAME*' ), 0 )
Alt( WildMatch ( GetFieldSelections(%Dimensions,'|'), '*EXPRESSION_NAME*' ), 0 )
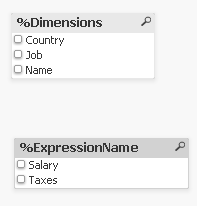
Then we can create 2 selectors, one for the dimensions and another one for the expressions using our data islands:

Now, whenever the user clicks on any checkbox the report will be constructed dinamically by using the conditional expressions which will search the dimension/expression name.
- Mark as Read
- Mark as New
- Bookmark
- Permalink
- Report Inappropriate Content
Hi Felipe,
When you create the table do you need to enter both of the expressions above? Can you post an example, I'm trying to replicate but having a little difficulty.
Thanks
- Mark as Read
- Mark as New
- Bookmark
- Permalink
- Report Inappropriate Content
Hello Felipe,
Ever thought of building an out of the box AdHoc analysis tool instead of listing the dimensions and measures? Maybe you'll like this solution.
,KR Koen