Unlock a world of possibilities! Login now and discover the exclusive benefits awaiting you.
- Qlik Community
- :
- All Forums
- :
- Qlik NPrinting
- :
- Re: Can we create Stacked Bar chart in NPrinting P...
- Subscribe to RSS Feed
- Mark Topic as New
- Mark Topic as Read
- Float this Topic for Current User
- Bookmark
- Subscribe
- Mute
- Printer Friendly Page
- Mark as New
- Bookmark
- Subscribe
- Mute
- Subscribe to RSS Feed
- Permalink
- Report Inappropriate Content
Can we create Stacked Bar chart in NPrinting PowerPoint Template
Hi All,
I am trying to create editable stacked bar chart using native charts in the PowerPoint Template of Qlik NPrinting. I observed that pivot table doesn't work in NPrinting, the only option left is to use side by side bar graph if I don't want to use image to get the chart as it is from Qlik Sense.
Please confirm if my understanding is correct.
Accepted Solutions
- Mark as New
- Bookmark
- Subscribe
- Mute
- Subscribe to RSS Feed
- Permalink
- Report Inappropriate Content
Hi,
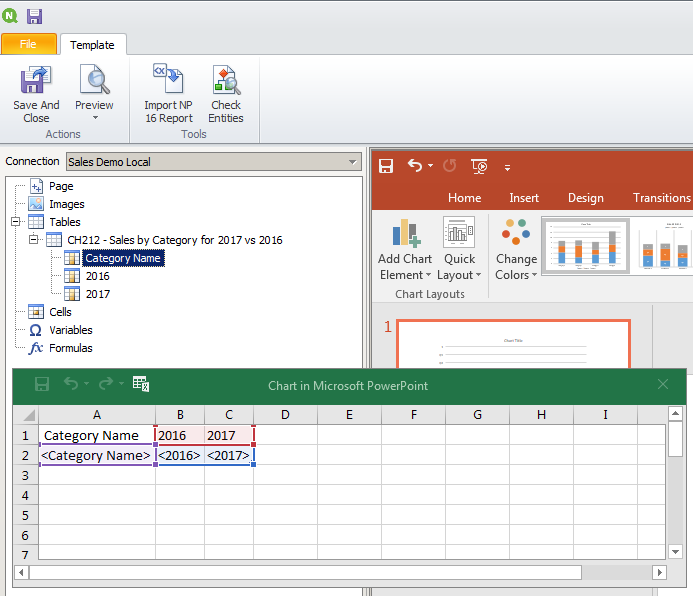
If you have a column and it is always called Category you place its tag in the template and all will be fine. Data will be exported from the connection every time the PowerPoint report will be generated and Qlik NPrinting will include all rows exported to build the chart.
Pivot tables are not supported in PowerPoint reports but they are supported in Excel reports.
As alternative you can import into PowerPoint templates as images.
Best Regards,
Ruggero
---------------------------------------------
When applicable please mark the appropriate replies as CORRECT https://community.qlik.com/docs/DOC-14806. This will help community members and Qlik Employees know which discussions have already been addressed and have a possible known solution. Please mark threads as HELPFUL if the provided solution is helpful to the problem, but does not necessarily solve the indicated problem. You can mark multiple threads as HELPFUL if you feel additional info is useful to others.
Best Regards,
Ruggero
---------------------------------------------
When applicable please mark the appropriate replies as CORRECT. This will help community members and Qlik Employees know which discussions have already been addressed and have a possible known solution. Please mark threads with a LIKE if the provided solution is helpful to the problem, but does not necessarily solve the indicated problem. You can mark multiple threads with LIKEs if you feel additional info is useful to others.
- Mark as New
- Bookmark
- Subscribe
- Mute
- Subscribe to RSS Feed
- Permalink
- Report Inappropriate Content
Hi,
Check this conversation Create a stacked bar chart with PowerPoint Object
Best Regards,
Ruggero
---------------------------------------------
When applicable please mark the appropriate replies as CORRECT https://community.qlik.com/docs/DOC-14806. This will help community members and Qlik Employees know which discussions have already been addressed and have a possible known solution. Please mark threads as HELPFUL if the provided solution is helpful to the problem, but does not necessarily solve the indicated problem. You can mark multiple threads as HELPFUL if you feel additional info is useful to others.
Best Regards,
Ruggero
---------------------------------------------
When applicable please mark the appropriate replies as CORRECT. This will help community members and Qlik Employees know which discussions have already been addressed and have a possible known solution. Please mark threads with a LIKE if the provided solution is helpful to the problem, but does not necessarily solve the indicated problem. You can mark multiple threads with LIKEs if you feel additional info is useful to others.
- Mark as New
- Bookmark
- Subscribe
- Mute
- Subscribe to RSS Feed
- Permalink
- Report Inappropriate Content
Hi rpc
Thank you for your response.
I have checked the attached conversation. In our case, the values in the filed are dynamic (i.e.. Column values are dynamic) and may change everytime. How to achieve it?
Regards,
Jaswanth P
- Mark as New
- Bookmark
- Subscribe
- Mute
- Subscribe to RSS Feed
- Permalink
- Report Inappropriate Content
I can't double check now...
but i remember trying to achieve the same in the past and i was not able to. With the current functionalities you will not be able to have dynamic "stacks" in your bar chart in PPT template.
I am interested what Ruggero will say, but i think he is likely to confirm what i just wrote rpc
cheers
Lech
- Mark as New
- Bookmark
- Subscribe
- Mute
- Subscribe to RSS Feed
- Permalink
- Report Inappropriate Content
Hi,
I have not clearly understand. In any case if you mean that columns are always the same and their data row vary Qlik NPrinting will use all of them in the chart.
Instead if you mean that the number of columns can vary Qlik NPrinting is not able to add or remove them and will use the ones you set when you build the chart.
Best Regards,
Ruggero
---------------------------------------------
When applicable please mark the appropriate replies as CORRECT https://community.qlik.com/docs/DOC-14806. This will help community members and Qlik Employees know which discussions have already been addressed and have a possible known solution. Please mark threads as HELPFUL if the provided solution is helpful to the problem, but does not necessarily solve the indicated problem. You can mark multiple threads as HELPFUL if you feel additional info is useful to others.
Best Regards,
Ruggero
---------------------------------------------
When applicable please mark the appropriate replies as CORRECT. This will help community members and Qlik Employees know which discussions have already been addressed and have a possible known solution. Please mark threads with a LIKE if the provided solution is helpful to the problem, but does not necessarily solve the indicated problem. You can mark multiple threads with LIKEs if you feel additional info is useful to others.
- Mark as New
- Bookmark
- Subscribe
- Mute
- Subscribe to RSS Feed
- Permalink
- Report Inappropriate Content
Hi,
In my case, column i.e categories are frequently changing and cannot be fixed as shown in the below screenshot -
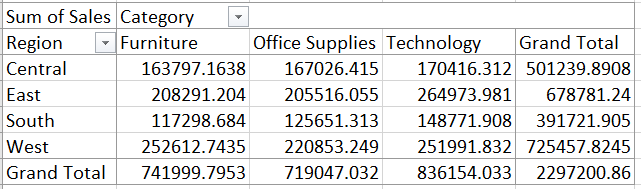
If Category values i.e. Furniture, Office Supplies, Technology etc. gets updated or appended with more values, fixed column way would not work, right?
Thanks,
Jaswanth P
- Mark as New
- Bookmark
- Subscribe
- Mute
- Subscribe to RSS Feed
- Permalink
- Report Inappropriate Content
Hi,
If you have a column and it is always called Category you place its tag in the template and all will be fine. Data will be exported from the connection every time the PowerPoint report will be generated and Qlik NPrinting will include all rows exported to build the chart.
Pivot tables are not supported in PowerPoint reports but they are supported in Excel reports.
As alternative you can import into PowerPoint templates as images.
Best Regards,
Ruggero
---------------------------------------------
When applicable please mark the appropriate replies as CORRECT https://community.qlik.com/docs/DOC-14806. This will help community members and Qlik Employees know which discussions have already been addressed and have a possible known solution. Please mark threads as HELPFUL if the provided solution is helpful to the problem, but does not necessarily solve the indicated problem. You can mark multiple threads as HELPFUL if you feel additional info is useful to others.
Best Regards,
Ruggero
---------------------------------------------
When applicable please mark the appropriate replies as CORRECT. This will help community members and Qlik Employees know which discussions have already been addressed and have a possible known solution. Please mark threads with a LIKE if the provided solution is helpful to the problem, but does not necessarily solve the indicated problem. You can mark multiple threads with LIKEs if you feel additional info is useful to others.