Unlock a world of possibilities! Login now and discover the exclusive benefits awaiting you.
- Qlik Community
- :
- All Forums
- :
- Qlik NPrinting
- :
- Re: Color change issues for a stacked bar chart in...
- Subscribe to RSS Feed
- Mark Topic as New
- Mark Topic as Read
- Float this Topic for Current User
- Bookmark
- Subscribe
- Mute
- Printer Friendly Page
- Mark as New
- Bookmark
- Subscribe
- Mute
- Subscribe to RSS Feed
- Permalink
- Report Inappropriate Content
Color change issues for a stacked bar chart in powerpoint
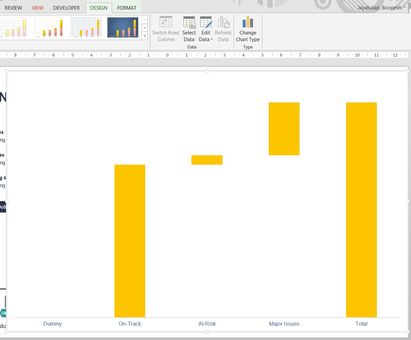
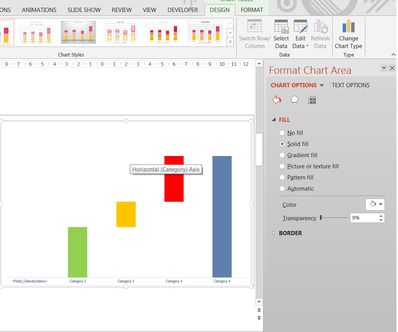
Aim : To create a waterfall chart using a stacked bar chart.
Steps done :
1) Insert stacked bar chart.
2) Add three columns from the table to the edit data. Close edit data.
3) In the main screen click on individual bars and change their colour to green, yellow, red and blue. And make another series fully invisible which makes the water fall effect.
Now when I preview it goes back to the default color. 😞
Any help is much appreciated.


Accepted Solutions
- Mark as New
- Bookmark
- Subscribe
- Mute
- Subscribe to RSS Feed
- Permalink
- Report Inappropriate Content
Hi,
My suggestion is to upgrade to latest version (November 2019 will be released soon) and test with it. I checked the release notes and I have not found solved issues similar to the one you have but we never correct issues on past release.
If you still have the issue with latest version, please open a support ticket with everything needed to reproduce and a link to this conversation. We need to investigate if there is a software issue behind.
Best Regards,
Ruggero
Best Regards,
Ruggero
---------------------------------------------
When applicable please mark the appropriate replies as CORRECT. This will help community members and Qlik Employees know which discussions have already been addressed and have a possible known solution. Please mark threads with a LIKE if the provided solution is helpful to the problem, but does not necessarily solve the indicated problem. You can mark multiple threads with LIKEs if you feel additional info is useful to others.
- Mark as New
- Bookmark
- Subscribe
- Mute
- Subscribe to RSS Feed
- Permalink
- Report Inappropriate Content
I don't want to sound too simplistic here but if you don't get any help with your question, I would suggest developing your chart in QlikView and using NPrinting to distribute the chart via an NPrinting report.
Just a thought if in the event that you don't receive feedback here.
- Mark as New
- Bookmark
- Subscribe
- Mute
- Subscribe to RSS Feed
- Permalink
- Report Inappropriate Content
Hi @Frank_S Thanks.
Already worked on that.
But as you are aware the quality of the charts generated directly on the Qlikview are not as good quality because it is rendered as an image. Mostly distorted and doesnt give the same look and feel 😞
- Mark as New
- Bookmark
- Subscribe
- Mute
- Subscribe to RSS Feed
- Permalink
- Report Inappropriate Content
Hi @boopeshj
Updated
There are fixes in NPrinting which as supposed to vastly improve image quality but QlikView 12.2 SR 7 or higher must be used. See attached release notes for Sept. 2018 SR 1 NPrinting. (this also applies to later versions of NPrinting as well but the improvement began with this version:
Improved image quality for QlikView objects
Jira issue ID: OP-6658
Exporting QlikView charts objects (excluding pivot and straight tables) as
images now produces images with a higher quality by using the same
mechanism used when exporting images from Qlik Sense objects. To
benefit from the improvement you must update to QlikView 12.20 SR7 or
newer.
Due to a QlikView bug, exported objects will always have the caption
enabled by setting the related user preferences option. You can hide the
caption of a specific object by disabling it in the source object properties.
You can disable this improvement by modifying the flag
useAdvancedImageExport in the QlikView.config file that is stored in the
Qlik NPrinting Engine installation folder.
Also, since you are using the PixelPerfect editor chart tool to create a waterfall chart with QV data, there may actually be a bug with the PxP editor and that specific chart type if you are not getting the results you need.
Please report support request to the Qlik Support desk to report any quality issues you are experiencing and if you feel there is a bug with the chart tool within the Pixel perfect editor.
Kind regards...
- Mark as New
- Bookmark
- Subscribe
- Mute
- Subscribe to RSS Feed
- Permalink
- Report Inappropriate Content
Updated:
Note: If you are using 'stretch' after you insert a QV chart image into any type of NPrinting report, that is equivalent to resizing an image to larger dimensions using microsoft paint for example. the result is a more grainy image. So essentially the image used in your report should be as is a not stretched in order to maintain the original image quality. Use something like fit inside or fit width via your report sizing options in the template editor.
- Mark as New
- Bookmark
- Subscribe
- Mute
- Subscribe to RSS Feed
- Permalink
- Report Inappropriate Content
Hi,
My suggestion is to upgrade to latest version (November 2019 will be released soon) and test with it. I checked the release notes and I have not found solved issues similar to the one you have but we never correct issues on past release.
If you still have the issue with latest version, please open a support ticket with everything needed to reproduce and a link to this conversation. We need to investigate if there is a software issue behind.
Best Regards,
Ruggero
Best Regards,
Ruggero
---------------------------------------------
When applicable please mark the appropriate replies as CORRECT. This will help community members and Qlik Employees know which discussions have already been addressed and have a possible known solution. Please mark threads with a LIKE if the provided solution is helpful to the problem, but does not necessarily solve the indicated problem. You can mark multiple threads with LIKEs if you feel additional info is useful to others.
- Mark as New
- Bookmark
- Subscribe
- Mute
- Subscribe to RSS Feed
- Permalink
- Report Inappropriate Content
Thanks @Ruggero_Piccoli and @Frank_S Could you please help me with the procedure to raise support ticket.
- Mark as New
- Bookmark
- Subscribe
- Mute
- Subscribe to RSS Feed
- Permalink
- Report Inappropriate Content
Hi,
Here there is the support contact form https://support.qlik.com/QS_ContactUs
Best Regards,
Ruggero
Best Regards,
Ruggero
---------------------------------------------
When applicable please mark the appropriate replies as CORRECT. This will help community members and Qlik Employees know which discussions have already been addressed and have a possible known solution. Please mark threads with a LIKE if the provided solution is helpful to the problem, but does not necessarily solve the indicated problem. You can mark multiple threads with LIKEs if you feel additional info is useful to others.
- Mark as New
- Bookmark
- Subscribe
- Mute
- Subscribe to RSS Feed
- Permalink
- Report Inappropriate Content
Is it possible for any Qlik user to create a support ticket or should be a partner or any other qualification ?
- Mark as New
- Bookmark
- Subscribe
- Mute
- Subscribe to RSS Feed
- Permalink
- Report Inappropriate Content
Hi @boopeshj You must be a Qlik Partner or a Qlik Customers with a paid maintenance agreement to register a support case.
Please contact your Qlik Partner manager for specific details. It is actually their job to assist you with that type of question regarding maintenance and support access queries as well as other Qlik Partner related questions that you may have.
Kind regards...