Unlock a world of possibilities! Login now and discover the exclusive benefits awaiting you.
- Qlik Community
- :
- All Forums
- :
- Qlik NPrinting
- :
- Create Combo chart in PowerPoint template in Qlik ...
- Subscribe to RSS Feed
- Mark Topic as New
- Mark Topic as Read
- Float this Topic for Current User
- Bookmark
- Subscribe
- Mute
- Printer Friendly Page
- Mark as New
- Bookmark
- Subscribe
- Mute
- Subscribe to RSS Feed
- Permalink
- Report Inappropriate Content
Create Combo chart in PowerPoint template in Qlik NPrinting
Hi All,
I want to create a combo chart in PowerPoint template Qlik NPrinting. The way we create combo chart in Qlik Sense i.e. bar chart and line graph similarly can we create one in NPrinting?
Thanks,
Jaswanth P
- Mark as New
- Bookmark
- Subscribe
- Mute
- Subscribe to RSS Feed
- Permalink
- Report Inappropriate Content
Hey polisetti
I would suggest building this in Qlik and then importing that chart object into your PowerPoint report. This is by far the easiest way to active what you are trying to do unless am I missing a point that you are struggling with?
I do however see that in a very recent post this seems to be removed from support in the latest version? (Re: N Printing is failing to generate image-text report) If so I would suggest following the same guidelines of rebuilding it in your report rather than importing it as the image.
- Mark as New
- Bookmark
- Subscribe
- Mute
- Subscribe to RSS Feed
- Permalink
- Report Inappropriate Content
Hi,
Just follow normal instructions https://help.qlik.com/en-US/nprinting/September2018/Content/NPrinting/PowerPointReports/Chart-Native... and select the combo chart.
Best Regards,
Ruggero
---------------------------------------------
When applicable please mark the appropriate replies as CORRECT https://community.qlik.com/docs/DOC-14806. This will help community members and Qlik Employees know which discussions have already been addressed and have a possible known solution. Please mark threads as HELPFUL if the provided solution is helpful to the problem, but does not necessarily solve the indicated problem. You can mark multiple threads as HELPFUL if you feel additional info is useful to others.
Best Regards,
Ruggero
---------------------------------------------
When applicable please mark the appropriate replies as CORRECT. This will help community members and Qlik Employees know which discussions have already been addressed and have a possible known solution. Please mark threads with a LIKE if the provided solution is helpful to the problem, but does not necessarily solve the indicated problem. You can mark multiple threads with LIKEs if you feel additional info is useful to others.
- Mark as New
- Bookmark
- Subscribe
- Mute
- Subscribe to RSS Feed
- Permalink
- Report Inappropriate Content
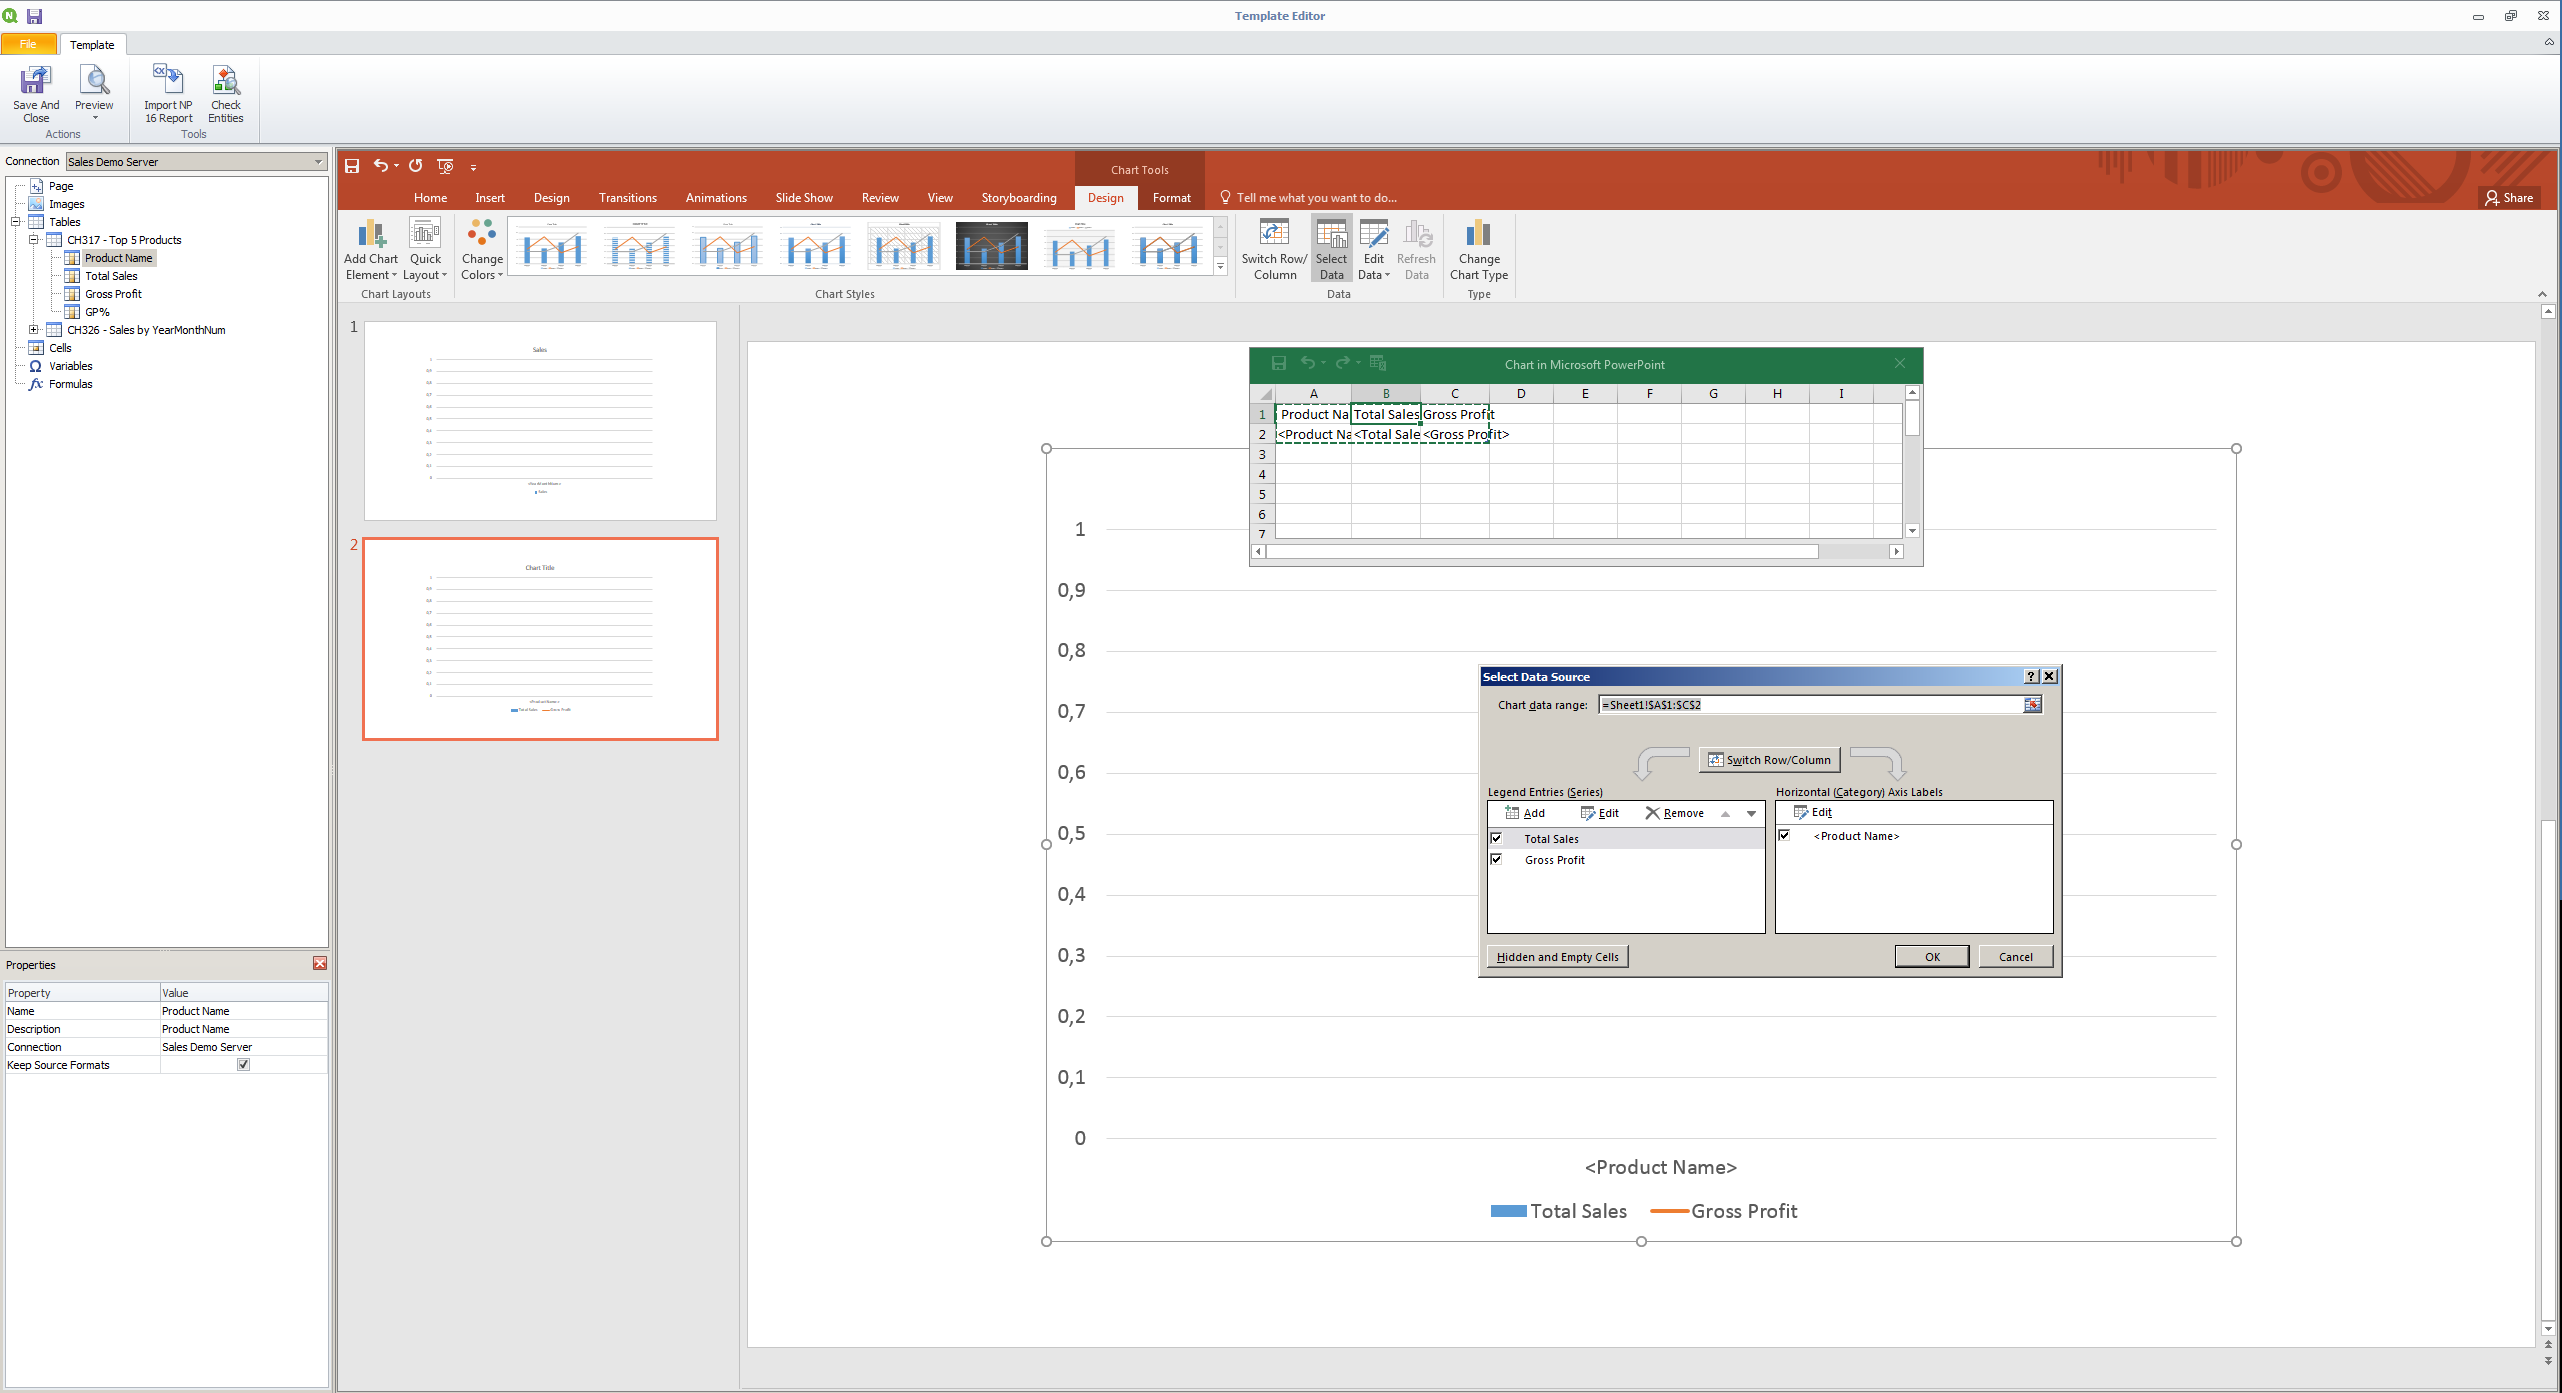
Hi,
I'm using 18.9.5 version of Qlik Nprinting, where in combo chart option is not present as shown in the screenshot below.

To build a combo chart, it should first be present in the template, right?
Best,
Jaswanth P
- Mark as New
- Bookmark
- Subscribe
- Mute
- Subscribe to RSS Feed
- Permalink
- Report Inappropriate Content
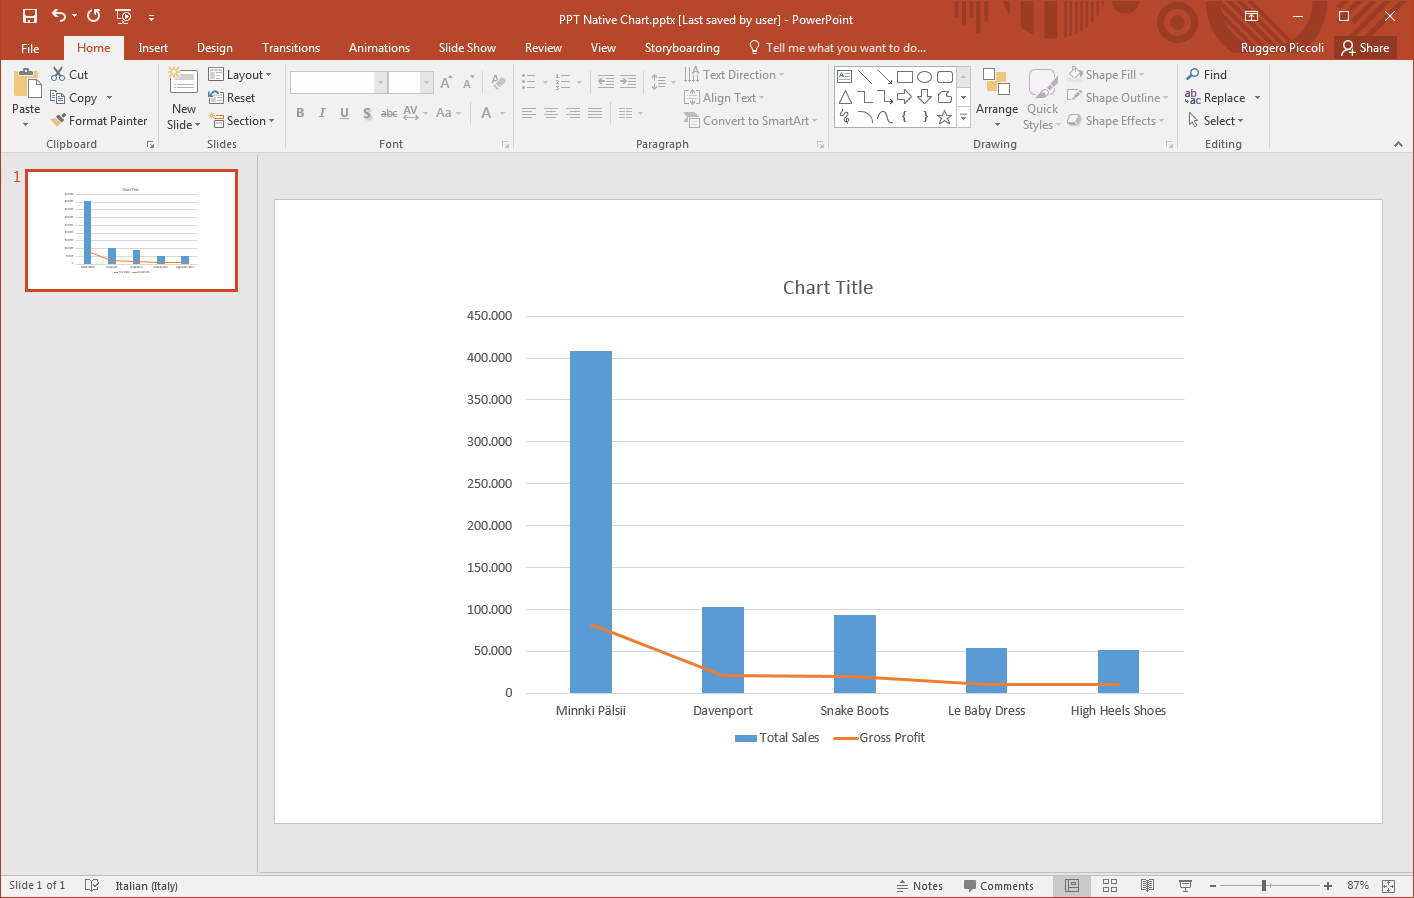
Hi Ruggero,
Please help me understand the case, if we have 2 dimensions year on X axis and stacked bar chart showing categories with Sales measure on one axis and second dual axis showing profit. Is this possible in NPrinting PowerPoint template?
Best,
Jaswanth P
- Mark as New
- Bookmark
- Subscribe
- Mute
- Subscribe to RSS Feed
- Permalink
- Report Inappropriate Content
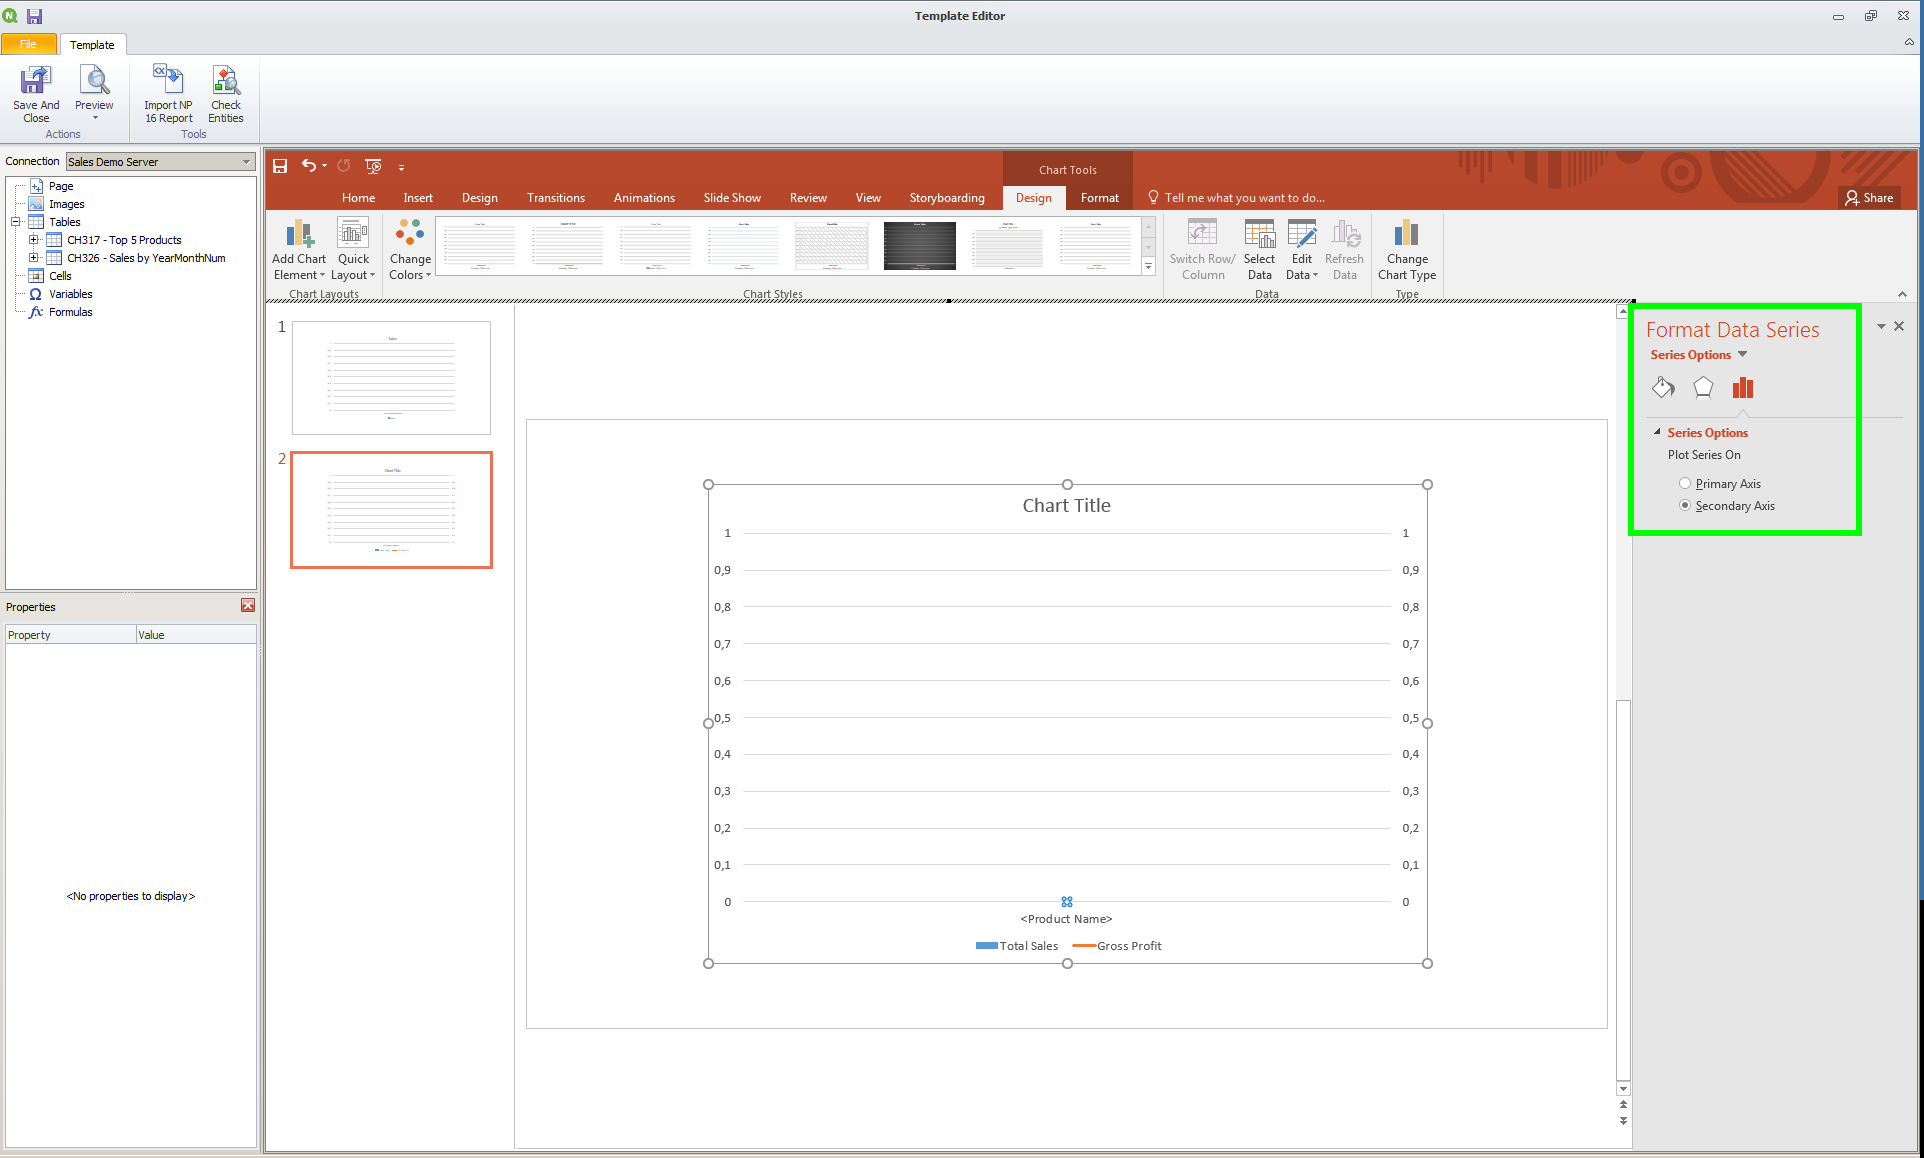
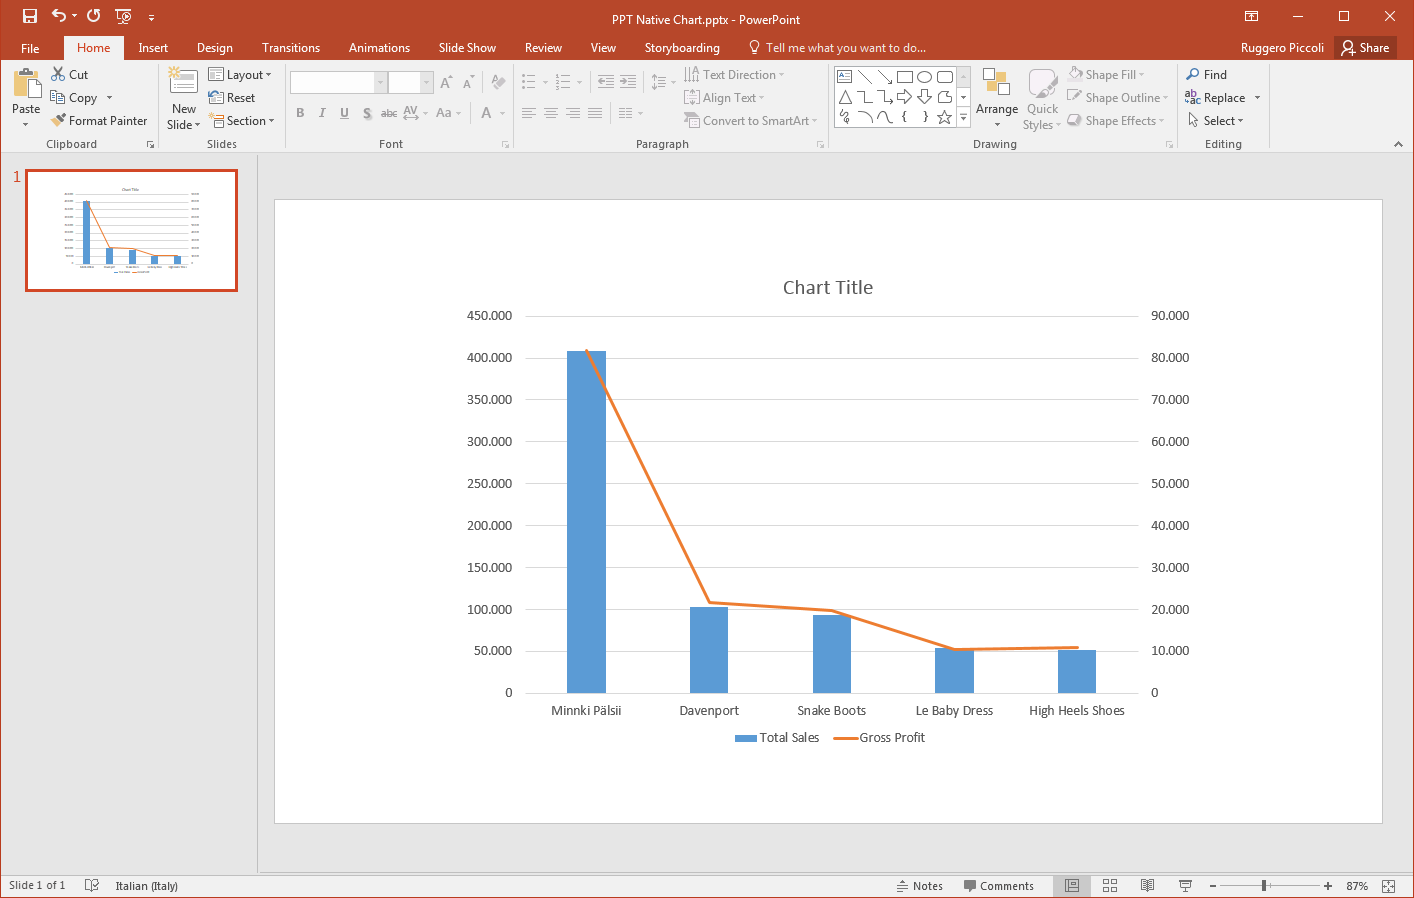
Hi,
Use the PowerPoint features and enable the secondary Y axis.
Best Regards,
Ruggero
---------------------------------------------
When applicable please mark the appropriate replies as CORRECT https://community.qlik.com/docs/DOC-14806. This will help community members and Qlik Employees know which discussions have already been addressed and have a possible known solution. Please mark threads as HELPFUL if the provided solution is helpful to the problem, but does not necessarily solve the indicated problem. You can mark multiple threads as HELPFUL if you feel additional info is useful to others.
Best Regards,
Ruggero
---------------------------------------------
When applicable please mark the appropriate replies as CORRECT. This will help community members and Qlik Employees know which discussions have already been addressed and have a possible known solution. Please mark threads with a LIKE if the provided solution is helpful to the problem, but does not necessarily solve the indicated problem. You can mark multiple threads with LIKEs if you feel additional info is useful to others.