Unlock a world of possibilities! Login now and discover the exclusive benefits awaiting you.
- Qlik Community
- :
- All Forums
- :
- Qlik NPrinting
- :
- Re: How to create tables in pixel perfect report i...
- Subscribe to RSS Feed
- Mark Topic as New
- Mark Topic as Read
- Float this Topic for Current User
- Bookmark
- Subscribe
- Mute
- Printer Friendly Page
- Mark as New
- Bookmark
- Subscribe
- Mute
- Subscribe to RSS Feed
- Permalink
- Report Inappropriate Content
How to create tables in pixel perfect report in nprinting
Hi all,
I have created a pixel perfect report in nprinting with 10 pages.
I want to add tables into 3,5,7,9th pages but I'm not able to do this.
Because my all the tables are starting from 10th page only. Because "Detail Report" area is going to be inserted after "Detail " area.
so how can I sort out this problems?
- Tags:
- qliksense
- Mark as New
- Bookmark
- Subscribe
- Mute
- Subscribe to RSS Feed
- Permalink
- Report Inappropriate Content
Hi ,
Just now I tried unbounding option but I got different output.
What I did is:-
After creating a table in "DeatilReport" I have undounded that "DeatilReport" due to this I got new blank "DetailReport" section.
Then in new blank detail report section I have created a Line graph. then after publishing the report to the newsstand I found that
1st row of table is coming 1st
then graph is coming
2nd row of table is coming
then graph
3rd row of table is coming
then graph
4th row of table
then graph
5th row of table
then graph
graph has repeated 5 times because I have values for that diemension
..
That's why I have not placed graph in "Deatilreport" section .
Everytime graph repeats .Even after unbounding the "deatilReport" Section also
- Mark as New
- Bookmark
- Subscribe
- Mute
- Subscribe to RSS Feed
- Permalink
- Report Inappropriate Content
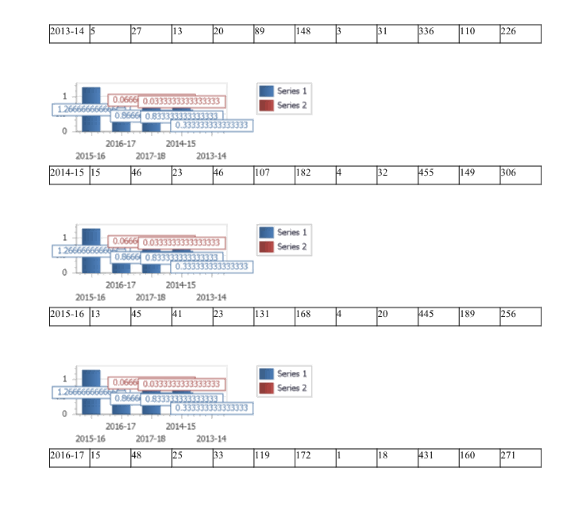
output after unbounding "DetailReport" we got a new "detailReport" but that is not a new separate "DetailReport"
section.
That is sub level of the previous "DetailReport" which has been unbounded .
output:-
- Mark as New
- Bookmark
- Subscribe
- Mute
- Subscribe to RSS Feed
- Permalink
- Report Inappropriate Content
Hi,
In PixelPefrect:
- you can put two native charts side-by-side
- you can put two images (from chart, tables, ect) side-by-side
- you CANNOT put anything side-by-side with a native table because it is generated by using levels.
Best Regards,
Ruggero
---------------------------------------------
When applicable please mark the appropriate replies as CORRECT https://community.qlik.com/docs/DOC-14806. This will help community members and Qlik Employees know which discussions have already been addressed and have a possible known solution. Please mark threads as HELPFUL if the provided solution is helpful to the problem, but does not necessarily solve the indicated problem. You can mark multiple threads as HELPFUL if you feel additional info is useful to others.
Best Regards,
Ruggero
---------------------------------------------
When applicable please mark the appropriate replies as CORRECT. This will help community members and Qlik Employees know which discussions have already been addressed and have a possible known solution. Please mark threads with a LIKE if the provided solution is helpful to the problem, but does not necessarily solve the indicated problem. You can mark multiple threads with LIKEs if you feel additional info is useful to others.
- Mark as New
- Bookmark
- Subscribe
- Mute
- Subscribe to RSS Feed
- Permalink
- Report Inappropriate Content
You inserted the chart in the detail level row of the table. This is the reason why you get this.
1 - Insert the QlikView or Qlik Sense objects you want to render as native tables in the Levels node
2 - Insert the QlikView or Qlik Sense objects you want to render as native tables in the Tables node
3 - Insert the first detail band and create the first table as documented
4 - Click on the white space on the bottom and select "Insert Detail Report" -> "Unbound". A new independent bar appears
5 - Create the first chart in the new bar.
6 - Click on the white space on the bottom and select "Insert Detail Report" -> "ID of the object to be used to create a new table"
7 - Create the second table
8 - Repeat the process
The template will looks like the following image.
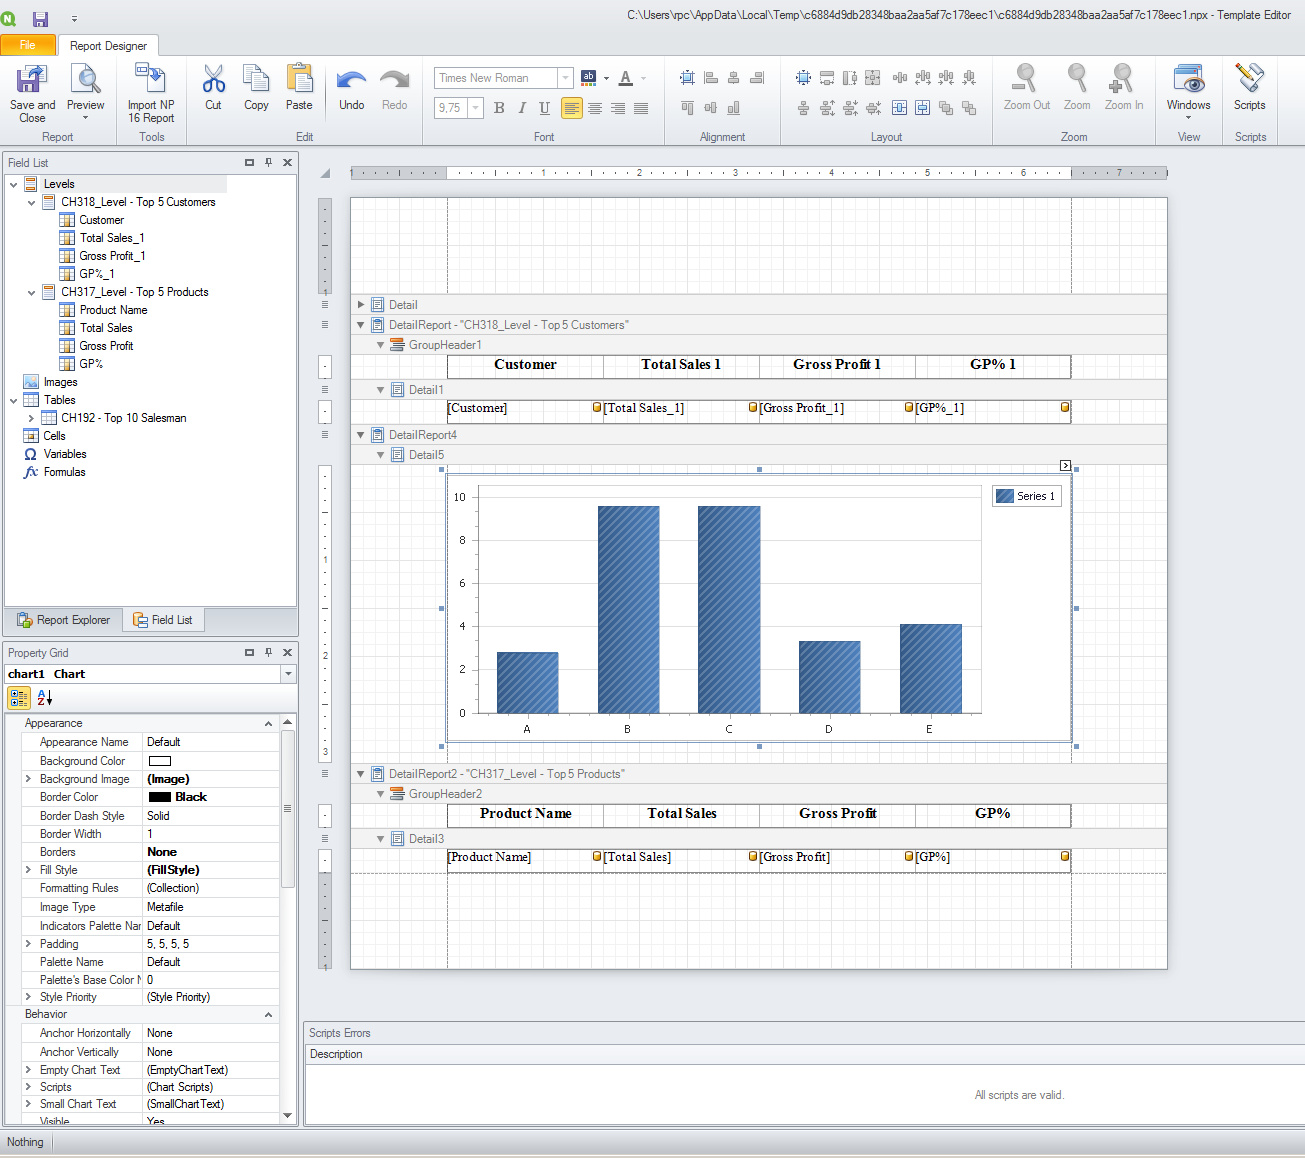
The output is attached.
The exported template is attachet. To use it you need to create a connectio to the Sales Demo.qvw sample document.
Best Regards,
Ruggero
---------------------------------------------
When applicable please mark the appropriate replies as CORRECT https://community.qlik.com/docs/DOC-14806. This will help community members and Qlik Employees know which discussions have already been addressed and have a possible known solution. Please mark threads as HELPFUL if the provided solution is helpful to the problem, but does not necessarily solve the indicated problem. You can mark multiple threads as HELPFUL if you feel additional info is useful to others.
Best Regards,
Ruggero
---------------------------------------------
When applicable please mark the appropriate replies as CORRECT. This will help community members and Qlik Employees know which discussions have already been addressed and have a possible known solution. Please mark threads with a LIKE if the provided solution is helpful to the problem, but does not necessarily solve the indicated problem. You can mark multiple threads with LIKEs if you feel additional info is useful to others.
- Mark as New
- Bookmark
- Subscribe
- Mute
- Subscribe to RSS Feed
- Permalink
- Report Inappropriate Content
yeah. I know this, I have gone through the video. But we have requirement so I was trying to do.
I just want the confirmation that we can do this or not.
In Video they have clearly mentioned that We can create graphs in "Detail" Section and tables in "DetailReport" section. We can also place many graphs side by side in "Detail" section.
Thanks a lot ...
- Mark as New
- Bookmark
- Subscribe
- Mute
- Subscribe to RSS Feed
- Permalink
- Report Inappropriate Content
I have unbounded the Detail1 so get "DetailReport1 and "Detail2" so I need to place the graph in Deail2?
- Mark as New
- Bookmark
- Subscribe
- Mute
- Subscribe to RSS Feed
- Permalink
- Report Inappropriate Content
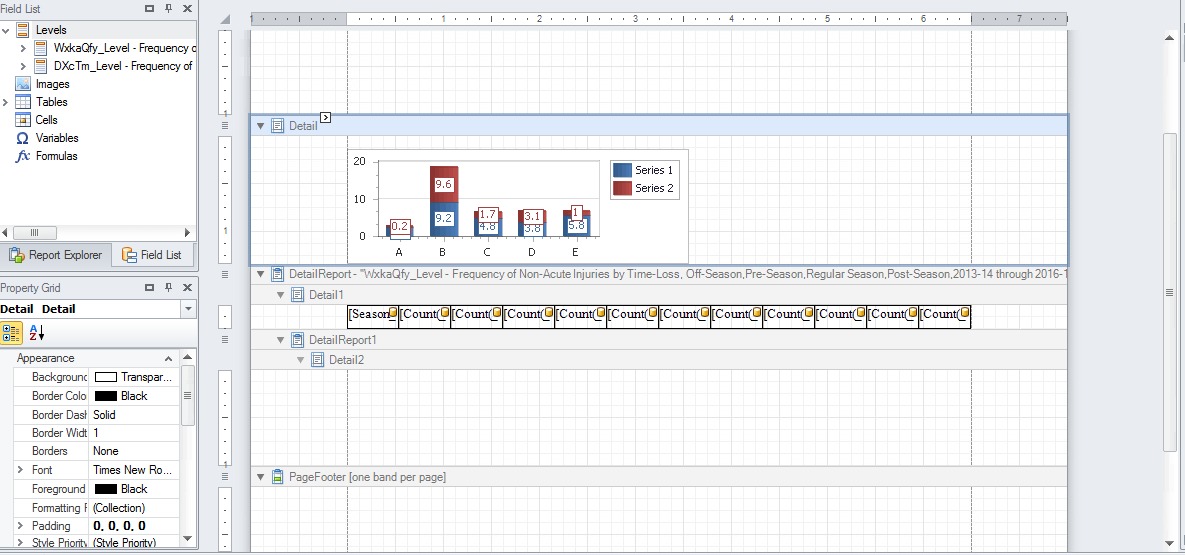
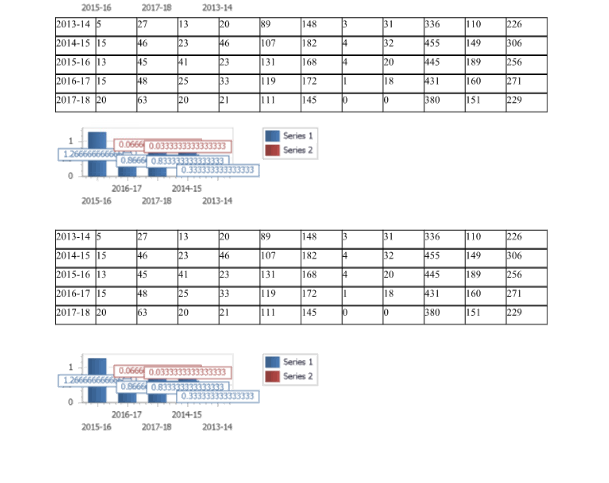
When I placed the image in Detial2
I got his output:-
graph is repeating after every row of the table.

- Mark as New
- Bookmark
- Subscribe
- Mute
- Subscribe to RSS Feed
- Permalink
- Report Inappropriate Content
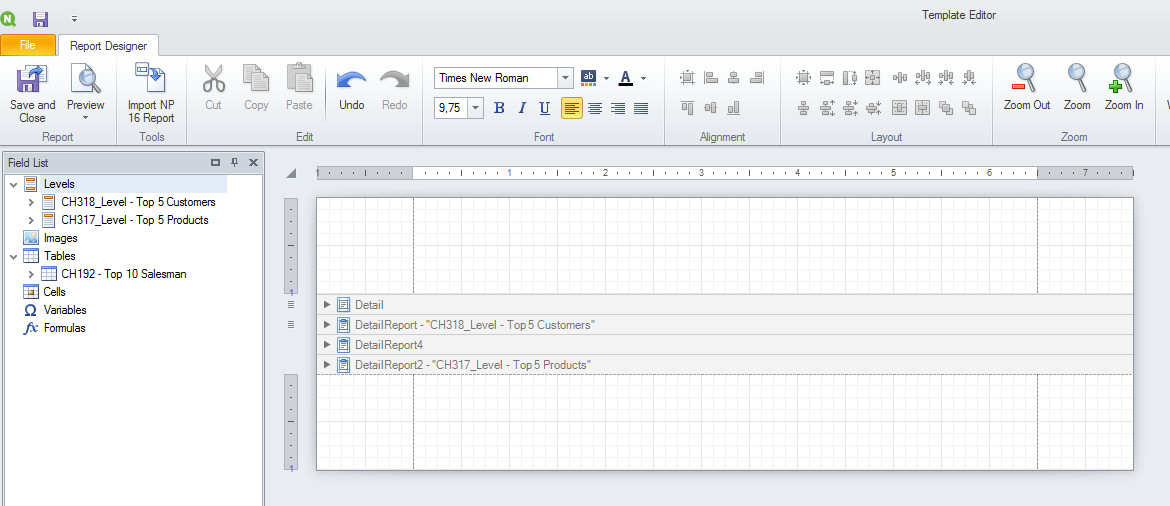
This is because the band that contains the chart is nested in the band with the table. The bands must be at the same hierarchical level.
For example, if I minimize the bands in my template they looks like the following image. Three bands all at the same level.
Best Regards,
Ruggero
---------------------------------------------
When applicable please mark the appropriate replies as CORRECT. This will help community members and Qlik Employees know which discussions have already been addressed and have a possible known solution. Please mark threads with a LIKE if the provided solution is helpful to the problem, but does not necessarily solve the indicated problem. You can mark multiple threads with LIKEs if you feel additional info is useful to others.
- Mark as New
- Bookmark
- Subscribe
- Mute
- Subscribe to RSS Feed
- Permalink
- Report Inappropriate Content
I got it,
I was unbound the wrong section .I have unbounded the section in which I have placed the table because of that new band was coming as a sub band of that section.
Then I was placing my graph in the new section that has been generated due to unbounding.
But I need to unbound "Detail section." After I need to place the graph in that new section.
I'm getting the proper output now:-
Thanks a lot.
- Mark as New
- Bookmark
- Subscribe
- Mute
- Subscribe to RSS Feed
- Permalink
- Report Inappropriate Content
Hi,
You cannot put something else side-by-side with a native table because it uses Levels. So, if you place a chart, it will be split for each value of the level.
The workaround is to import the source table as an image where possible.
You can place two or more native charts side-by-side because they don't use Levels.
Best Regards,
Ruggero
---------------------------------------------
When applicable please mark the appropriate replies as CORRECT https://community.qlik.com/docs/DOC-14806. This will help community members and Qlik Employees know which discussions have already been addressed and have a possible known solution. Please mark threads as HELPFUL if the provided solution is helpful to the problem, but does not necessarily solve the indicated problem. You can mark multiple threads as HELPFUL if you feel additional info is useful to others.
Best Regards,
Ruggero
---------------------------------------------
When applicable please mark the appropriate replies as CORRECT. This will help community members and Qlik Employees know which discussions have already been addressed and have a possible known solution. Please mark threads with a LIKE if the provided solution is helpful to the problem, but does not necessarily solve the indicated problem. You can mark multiple threads with LIKEs if you feel additional info is useful to others.