Unlock a world of possibilities! Login now and discover the exclusive benefits awaiting you.
- Qlik Community
- :
- All Forums
- :
- Qlik NPrinting
- :
- Re: NPrinting - possible to page on a field and in...
- Subscribe to RSS Feed
- Mark Topic as New
- Mark Topic as Read
- Float this Topic for Current User
- Bookmark
- Subscribe
- Mute
- Printer Friendly Page
- Mark as New
- Bookmark
- Subscribe
- Mute
- Subscribe to RSS Feed
- Permalink
- Report Inappropriate Content
NPrinting - possible to page on a field and include overall summary?
Hi All,
I've been searching for a way to create an Excel Report for NPrinting On Demand which has summary information in a table at the top of the report, followed by another table which pages by a specific field. For instance, say I want the end user to select a Sales Region, and then print the report. Then I would want the report to show cumulative numbers in the expressions of the table across any dimensions for that region, and then below go into detail and page by each Sales Person associated with that region. Is this possible and I'm simply missing something? I believe it can be done with QlikView's native reporting... but I haven't yet found a way to accomplish it in NPrinting. I can get the report to page by the Sales Person but I can't get it to leave the summary table alone. Alternatively, it would work if I could level by the Sales Person instead and repeat a page break within each instance of the level range... but I couldn't make that work either. I tried adding a page break within the level range but it only recognized it once and didn't repeat.
Any help would be greatly appreciated. Thanks!
Corey
Accepted Solutions
- Mark as New
- Bookmark
- Subscribe
- Mute
- Subscribe to RSS Feed
- Permalink
- Report Inappropriate Content
Hi Corey,
QlikView NPrinting allows you to add paging to a particular Excel sheet. How to Use the Page Feature in Excel and PowerPoint Report Templates
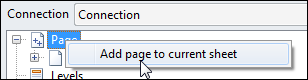
Lets say you have a table containing Regions, Countries & Population. You could place a chart containing all details on Sheet1, place another instance of the same chart (or another appropriate chart) on Sheet2 and page by Country only on Sheet2.
I have attached a project that demonstrates this. If your On-demand user selects Region NORTHERN AMERICA & clicks Run report
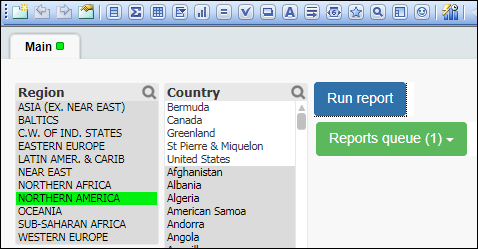
QlikView NPrinting generates a report with All countries in NORTHERN AMERICA on Sheet All Countries and a separate sheet for each country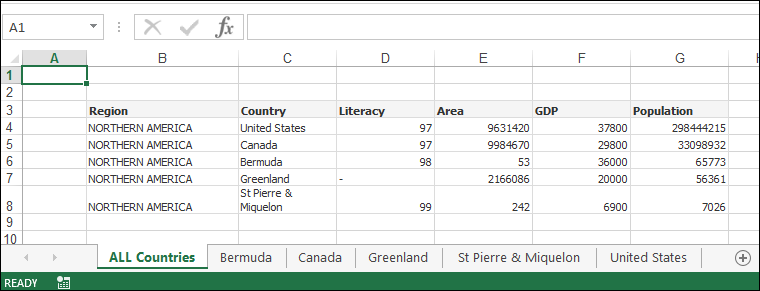
You can of course do something similar with Levels if you want everything on one sheet.

Extract to folder C:\Temp\Community\036 to preserver the paths used or change them in the nsq.
HTH - Daniel.
- Mark as New
- Bookmark
- Subscribe
- Mute
- Subscribe to RSS Feed
- Permalink
- Report Inappropriate Content
Hi Corey,
QlikView NPrinting allows you to add paging to a particular Excel sheet. How to Use the Page Feature in Excel and PowerPoint Report Templates
Lets say you have a table containing Regions, Countries & Population. You could place a chart containing all details on Sheet1, place another instance of the same chart (or another appropriate chart) on Sheet2 and page by Country only on Sheet2.
I have attached a project that demonstrates this. If your On-demand user selects Region NORTHERN AMERICA & clicks Run report
QlikView NPrinting generates a report with All countries in NORTHERN AMERICA on Sheet All Countries and a separate sheet for each country
You can of course do something similar with Levels if you want everything on one sheet.
Extract to folder C:\Temp\Community\036 to preserver the paths used or change them in the nsq.
HTH - Daniel.
- Mark as New
- Bookmark
- Subscribe
- Mute
- Subscribe to RSS Feed
- Permalink
- Report Inappropriate Content
Thanks! I think I tried something along those lines, but didn't realize I needed to make another instance of the chart instead of using the same one. Either way, I followed the instructions in your link and was able to accomplish what I was looking for.