Unlock a world of possibilities! Login now and discover the exclusive benefits awaiting you.
- Qlik Community
- :
- All Forums
- :
- Qlik NPrinting
- :
- Re: Nprinting 16: Remove Blank Pages (Excel)
- Subscribe to RSS Feed
- Mark Topic as New
- Mark Topic as Read
- Float this Topic for Current User
- Bookmark
- Subscribe
- Mute
- Printer Friendly Page
- Mark as New
- Bookmark
- Subscribe
- Mute
- Subscribe to RSS Feed
- Permalink
- Report Inappropriate Content
Nprinting 16: Remove Blank Pages (Excel)
I am still stuck on this requirement and need some help...no luck so far.
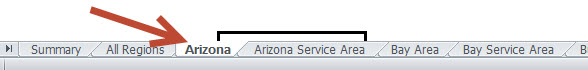
My NSQ creates an Excel doc with paging by REQUEST_REGION. Each tab contains 2 charts, an image and some random text.
My requirement is to remove the tab if CH229 is empty.I've played with conditional formatting and variables but I cannot get it to work.
I've been working on this for 2 weeks and cannot make it work.
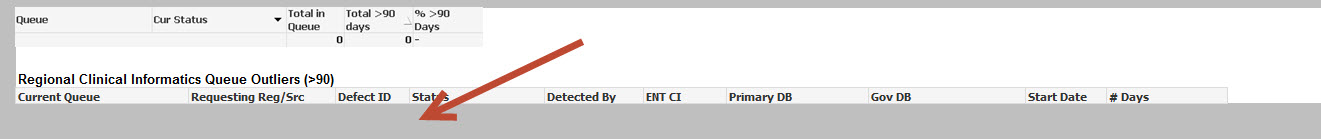
Here's an example of a tab that I want removed (Arizona) because CH229 is blank:
TIA!
- « Previous Replies
-
- 1
- 2
- Next Replies »
Accepted Solutions
- Mark as New
- Bookmark
- Subscribe
- Mute
- Subscribe to RSS Feed
- Permalink
- Report Inappropriate Content
Hi,
Let me explain better...
The Page feature allows you to use a field (only one) for cycling and creating a different sheet for each value of that field.
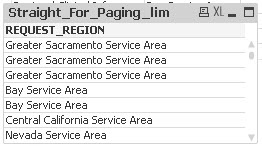
If you create a Straight table that contains at the very end only one field, even if calculated and even if in reality the table contains more columns but all but one are hidden, then you will be able to use the table for the page.
So finally, the final (visible) table need to show only one field in order to be visible in the Page field list.
Last thing.. the fact that you see the same value more than one time, is caused by the presence of multiple dimensions in the table, even if hidden.
I've no knowledge on your data structure but I think you should remove unuseful fields with regards to page.
Hope this helps
Andrea
- Mark as New
- Bookmark
- Subscribe
- Mute
- Subscribe to RSS Feed
- Permalink
- Report Inappropriate Content
Try with this:
- create a straight table using the dimension you need and the measure that determines which charts become empty (in your case what is causing CH229 to be emty).
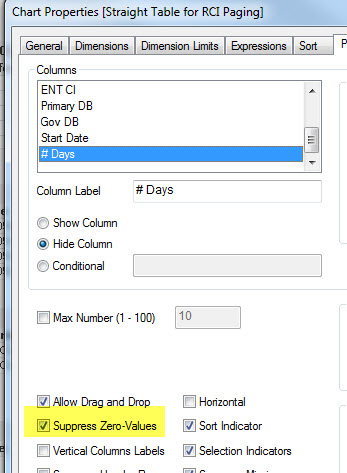
- enable the "suppress zero values" for that measur. THIS STEP IS IMPORTANT otherwise you won't see the straight in the list of available entities for page
- add whatever you need in each sheet
- click on preview.
- you shouldn't see any sheet for values that has the chart empty (in the attached example Germany)
see attached samples.
In order to use them, please download and respect the folder structure:
- "\NPrintingFiles" for the nsq project
- "\Templates" for the template
- "\QlikViewDocuments" for the doc
Hope this helps.
Andrea
---------------------------------------------
When applicable please mark the appropriate replies as CORRECT. This will help community members and Qlik Employees know which discussions have already been addressed and have a possible known solution. Please mark threads as HELPFUL if the provided solution is helpful to the problem, but does not necessarily solve the indicated problem. You can mark multiple threads as HELPFUL if you feel additional info is useful to others.
- Mark as New
- Bookmark
- Subscribe
- Mute
- Subscribe to RSS Feed
- Permalink
- Report Inappropriate Content
- enable the "suppress zero values" for that measur. THIS STEP IS IMPORTANT otherwise you won't see the straight in the list of available entities for page
You mean for the Expression via the Presentation tab, right? I have this but it isn't showing up.
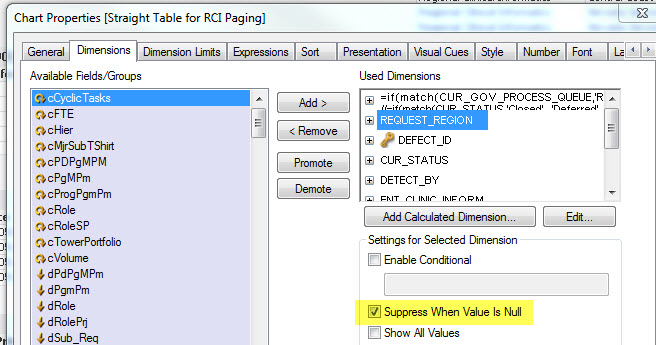
I also have it on the Dimension itself:
- Mark as New
- Bookmark
- Subscribe
- Mute
- Subscribe to RSS Feed
- Permalink
- Report Inappropriate Content
My straight table show's the same dimension more than once - because of the other fields included. It's throwing off my paging because it's creating multiples. What am I missing?

- Mark as New
- Bookmark
- Subscribe
- Mute
- Subscribe to RSS Feed
- Permalink
- Report Inappropriate Content
My straight table show's the same dimension more than once - because of the other fields included. It's throwing off my paging because it's creating multiples. What am I missing?
That is why you have to create another straight table which will exclude "those other fields" and use it as a paging entinty in NPrinting template.
regards
Lech
- Mark as New
- Bookmark
- Subscribe
- Mute
- Subscribe to RSS Feed
- Permalink
- Report Inappropriate Content
Hi,
Let me explain better...
The Page feature allows you to use a field (only one) for cycling and creating a different sheet for each value of that field.
If you create a Straight table that contains at the very end only one field, even if calculated and even if in reality the table contains more columns but all but one are hidden, then you will be able to use the table for the page.
So finally, the final (visible) table need to show only one field in order to be visible in the Page field list.
Last thing.. the fact that you see the same value more than one time, is caused by the presence of multiple dimensions in the table, even if hidden.
I've no knowledge on your data structure but I think you should remove unuseful fields with regards to page.
Hope this helps
Andrea
- Mark as New
- Bookmark
- Subscribe
- Mute
- Subscribe to RSS Feed
- Permalink
- Report Inappropriate Content
The other dimensions are needed and useful. What I think you are saying, however, is for paging purposes, perhaps they aren't needed. I will try it, thanks!
- Mark as New
- Bookmark
- Subscribe
- Mute
- Subscribe to RSS Feed
- Permalink
- Report Inappropriate Content
I think I am making progress, but I still have issues because the actual chart has some logic for the dimensions and expressions and I can't figure out how to carry that to a straight table for paging.
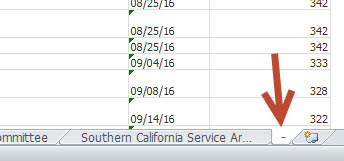
Please see attached.
For example, I see this tab with - as the dimension and everything listed and I don't know why. Also, there are still some blank tabs in the excel output. I assume this is because the logic for the current straight table for paging doesn't exactly match the actual chart logic.
- Mark as New
- Bookmark
- Subscribe
- Mute
- Subscribe to RSS Feed
- Permalink
- Report Inappropriate Content
Did you enable "suppress missing", "suppress zero-values" in the presentation tab for each chart you are using (especially for the one used for paging)?
Everything you see in the chart in terms of rows should become a tab.
Also remember to delete the other empty sheets from the template. I'm referring to the ones added by default when creating a new Excel workbook (Sheet1, Sheet2, Sheet3).
- Mark as New
- Bookmark
- Subscribe
- Mute
- Subscribe to RSS Feed
- Permalink
- Report Inappropriate Content
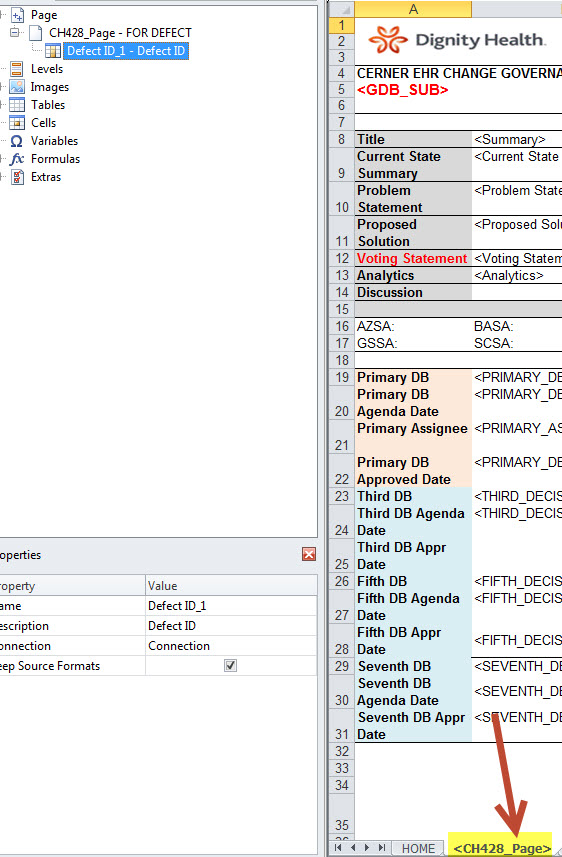
I'm trying a similar solution on another file but the page is showing as the page name, not the field. How do I get it to Page on DEFECT ID?
- « Previous Replies
-
- 1
- 2
- Next Replies »