Unlock a world of possibilities! Login now and discover the exclusive benefits awaiting you.
- Qlik Community
- :
- All Forums
- :
- Qlik NPrinting
- :
- Re: Nprinting Multiple Dynamic Values in a Filter
- Subscribe to RSS Feed
- Mark Topic as New
- Mark Topic as Read
- Float this Topic for Current User
- Bookmark
- Subscribe
- Mute
- Printer Friendly Page
- Mark as New
- Bookmark
- Subscribe
- Mute
- Subscribe to RSS Feed
- Permalink
- Report Inappropriate Content
Nprinting Multiple Dynamic Values in a Filter
I have a snap shot of my data for each month. I have a chart that will display whatever dates are selected. I need to export that chart with the current date, last quarter and last December selected. I have three variables to identify the needed as of dates. It works if I only have one date, So how do I add more? I can do it with static values, but not with my variables. I am sure I am missing something simple.
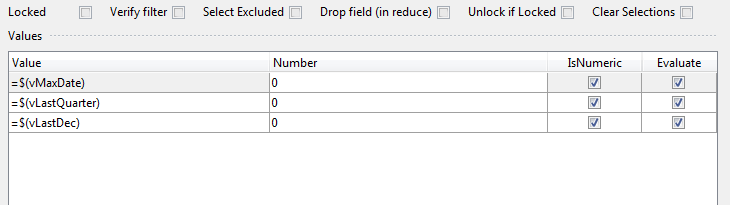
This is an image of what I am trying to accomplish.
Thanks
Accepted Solutions
- Mark as New
- Bookmark
- Subscribe
- Mute
- Subscribe to RSS Feed
- Permalink
- Report Inappropriate Content
The solution was that I had some variables defined in the dashboard and other in Nprinting. It would not assign all the values until I made them all in Qlikview. Then I was able to apply multiple dynamic values to a single filter based on variables. Thank you all for your help
- Mark as New
- Bookmark
- Subscribe
- Mute
- Subscribe to RSS Feed
- Permalink
- Report Inappropriate Content
If I understand your objective correctly, you can use object level filtering to achieve the result you are looking for.
Check this tutorial for more information.
How to Apply a Specific Filter to Tables or Images
- Mark as New
- Bookmark
- Subscribe
- Mute
- Subscribe to RSS Feed
- Permalink
- Report Inappropriate Content
The question was not how to apply a filter, but how to create a filter that will apply more than one dynamic value.
- Mark as New
- Bookmark
- Subscribe
- Mute
- Subscribe to RSS Feed
- Permalink
- Report Inappropriate Content
You will need to create a dynamic 'variable' filter.
Choose the 'variable' option rather than the field option
Add your calculation value and select calculate as shown in the image below.
If you need the data in your chart to change based on the variable filter, you can follow this tutorial.
Set a QlikView Variable to a Specific Value Using Filters
- Mark as New
- Bookmark
- Subscribe
- Mute
- Subscribe to RSS Feed
- Permalink
- Report Inappropriate Content
I already have the variables with their correct values. I am trying to apply filters based on the values in the variables. I can apply a filter for a date field with three values if I enumerate the exact values.
For example, if the filter assigns the dates "June", "July", and "September" it would work fine.
But if the filter assigns the dates $(vMonth1), $(vMonth2), and $(vMonth3) it fails to apply the selections.
If this is not possible, I am sorry for wasting your time.
- Mark as New
- Bookmark
- Subscribe
- Mute
- Subscribe to RSS Feed
- Permalink
- Report Inappropriate Content
Hi Erik,
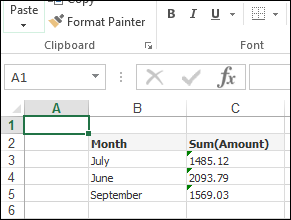
Taking your most recent example, if your chart and variables in your QlikView document look something like this:

And you want your NPrinting Excel report with the above table filtered like this:
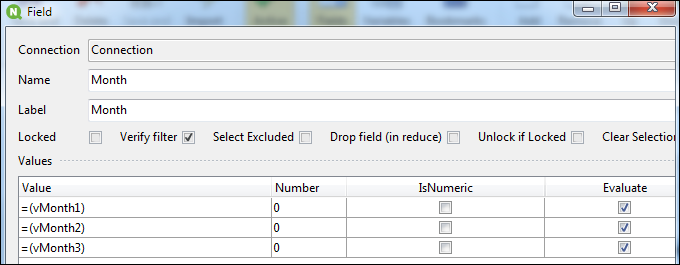
Your NPrinting Field type filter definition would look like this:
I have attached a sample project. Please extract to folder C:\Temp\Community\014 in order to preserve the paths used or you will need to change them manually in the NSQ.
HTH - Daniel.
- Mark as New
- Bookmark
- Subscribe
- Mute
- Subscribe to RSS Feed
- Permalink
- Report Inappropriate Content
The solution was that I had some variables defined in the dashboard and other in Nprinting. It would not assign all the values until I made them all in Qlikview. Then I was able to apply multiple dynamic values to a single filter based on variables. Thank you all for your help