Unlock a world of possibilities! Login now and discover the exclusive benefits awaiting you.
- Qlik Community
- :
- All Forums
- :
- Qlik NPrinting
- :
- Re: dimension number format not working in excel
- Subscribe to RSS Feed
- Mark Topic as New
- Mark Topic as Read
- Float this Topic for Current User
- Bookmark
- Subscribe
- Mute
- Printer Friendly Page
- Mark as New
- Bookmark
- Subscribe
- Mute
- Subscribe to RSS Feed
- Permalink
- Report Inappropriate Content
dimension number format not working in excel
Hi, all,
I use nprining 16.3 and QV 11.20 SR12.
I am export a pivot table in an nprinting excel template. The dimension Unit with number format '#,##0.00' is exported as General (default number in excel).
My desired output:
| Cur | Unit | Num |
| EUR | 1.80 | 626 |
| EUR | 1.80 | 18 |
| USD | 1.80 | 8 |
| EUR | 0.45 | 160 |
The actual output:
| Cur | Unit | Num |
| EUR | 1.8 | 626 |
| EUR | 1.8 | 18 |
| USD | 1.8 | 8 |
| EUR | 0.45 | 160 |
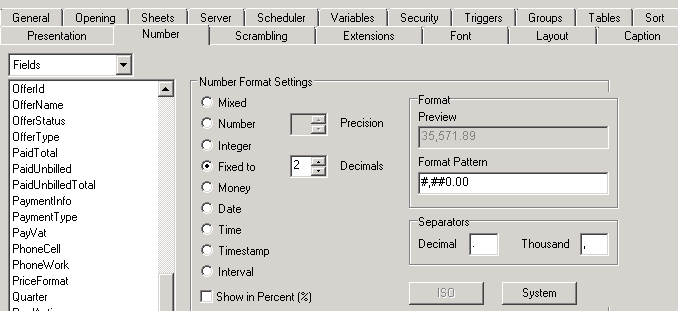
I modified the Document property ->Number for Unit field, and it does not work. The Unit is all number with 2 decimals, no string.
This can also be test by just export the table to excel in QV, get the same result with "General" format.
May I know how can I get my required number format?
Thanks
Zhihong
- Tags:
- data format
- dimension
- Mark as New
- Bookmark
- Subscribe
- Mute
- Subscribe to RSS Feed
- Permalink
- Report Inappropriate Content
Hi,
The problem is that you use Number which strips the trailing zeroes. Use Fixed to 2 decimals instead.
BR,
Matus
- Mark as New
- Bookmark
- Subscribe
- Mute
- Subscribe to RSS Feed
- Permalink
- Report Inappropriate Content
Hi, Matus,
Thanks.
I do use the decimals, both in the load script, and in the dimension number format setting.
And format are correct in the dash, but when export to excel, then it does not work.
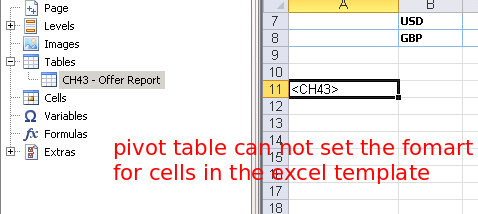
And BTW, I use the "Table" template in nprinting excel template, as this is a pivot table, so can not set the format for the cells in excel.
Also tried to set the format for the column in the generated report, which gonna hold data for that dimension.
No luck as well.
See attachment below:


- Mark as New
- Bookmark
- Subscribe
- Mute
- Subscribe to RSS Feed
- Permalink
- Report Inappropriate Content
Sorry, I missed that it is pivot.
It seems that pivot can not export the dimensions as number.
Can't you use straight table?
Matus
- Mark as New
- Bookmark
- Subscribe
- Mute
- Subscribe to RSS Feed
- Permalink
- Report Inappropriate Content
Hi, Mauts,
No, as we need total in different dimension level, so pivot is a better solution. Otherwise,
need to calculate in the nprinting template.
Then I think we need to sacrifice the Unit format here.
Thanks for your help!
Zhihong
- Mark as New
- Bookmark
- Subscribe
- Mute
- Subscribe to RSS Feed
- Permalink
- Report Inappropriate Content
Hi Zhihong,
Why not use a straight table as the source & build the PivotTable in your NPrinting Excel report template? How to Create a Pivot Table from Excel Table Columns
HTH - Daniel.
- Mark as New
- Bookmark
- Subscribe
- Mute
- Subscribe to RSS Feed
- Permalink
- Report Inappropriate Content
Hi, Daniel,
Thanks for the suggestion. I do have experience with creating pivot table using levels. and that takes ages.
The link you sharing is a great idea to improve that!!!
But the way in the link seems perfect to generate one pivot table, I do not know whether it works by using level to get report for different clients, in one sheet. I will give it a try. Thanks
Zhihong