Unlock a world of possibilities! Login now and discover the exclusive benefits awaiting you.
- Qlik Community
- :
- Forums
- :
- Forums by Product
- :
- Products (A-Z)
- :
- Qlik Sense
- :
- Documents
- :
- Cycle dimensions using a variable button or dropdo...
- Move Document
- Delete Document
- Subscribe to RSS Feed
- Mark as New
- Mark as Read
- Bookmark
- Subscribe
- Printer Friendly Page
- Report Inappropriate Content
Cycle dimensions using a variable button or dropdown
- Move Document
- Delete Document and Replies
- Mark as New
- Bookmark
- Subscribe
- Mute
- Subscribe to RSS Feed
- Permalink
- Report Inappropriate Content
Cycle dimensions using a variable button or dropdown
Cycle dimensions that change multiple objects with one selection have been a powerful tool in Qlik visualisations and dashboards. Whilst this has not quite made it into the product there is a very simple workaround that enables you to get all of your charts dynamically changing. This can used for both dimensions and measures (see this link for an example using measures).
Here's a quick example (plays 2 times)
Steps to implement
> Download and install the QSVariable extension from Branch (or see attached for the version at the time of writing).
> To create a cyclic dimension:
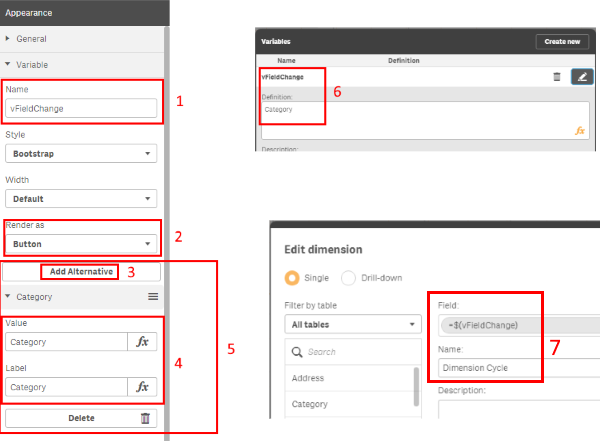
1. Specify a variable name. If you have not already created this variable it will create it in the application.
2. Select Button or Select (dropdown) in the 'Render as' option. You can also experiment with the style and width setting to get different effects.
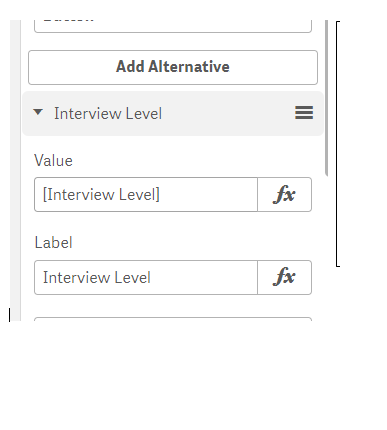
3. Click 'Add Alternative'
4. Enter in the Value and the Label for the option you want to setup. The 'Value' will be passed into the variable and so this should match your fieldname identically (i.e. case sensitive and use square brackets where there is a space in your fieldname e.g. [Customer Name])
5. Repeat steps 3 and 4 for each additional option you wish to show and switch between.
6. Enter the default value for the variable so that a selection is always made on open.
a. In the Edit sheet window, click on the following button in the bottom left.
![]()
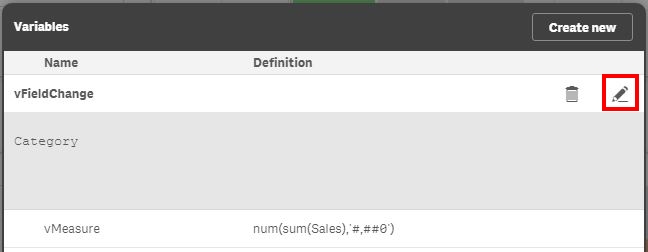
b. In the Variable window that pops up, click on the edit icon of the variable you wish to update.
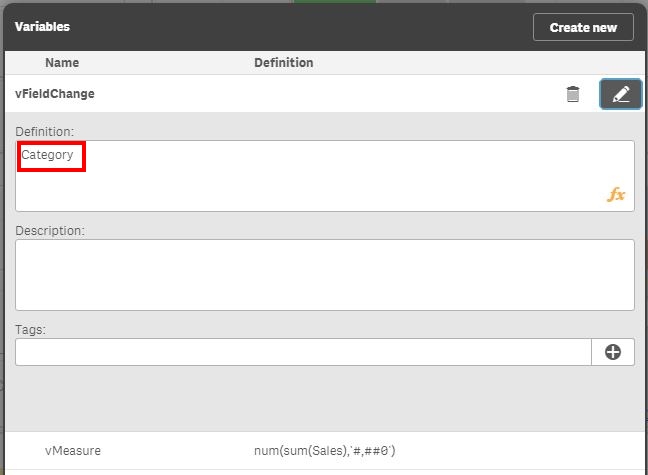
c. Enter the Value that will be the default value for your variable. Ensure that it is one of the values that you have entered in the variable extension object. When done click on the edit button again to save and close the window.
7. Create a dimension in your master items (or reference directly in each chart) using the variable reference as $(VariableName).
Known Limitations
> We are unable to dynamically label dimensions and measures at this stage (as of writing after release of v3.1). As such you have generic naming of the dynamic field.
See the attached example for more details or comment below.
Thanks
- Move Comment
- Delete Comment
- Mark as Read
- Mark as New
- Bookmark
- Permalink
- Report Inappropriate Content
Thankyou , I got all working as I wanted with your guidance!
Prana
- Move Comment
- Delete Comment
- Mark as Read
- Mark as New
- Bookmark
- Permalink
- Report Inappropriate Content
Hi - thanks for this extension. Works great. The one thing I noticed - I was creating the variable on my own and then trying to use it inside the extension. It didn't work. Then I looked at your instructions again and saw that you are creating the variable through the extension. I deleted the original variable and created the same one through the extension and that worked for me. If you notice the same behavior at your end you might want to add that to the instructions. Hope this helps. Thanks!
- Move Comment
- Delete Comment
- Mark as Read
- Mark as New
- Bookmark
- Permalink
- Report Inappropriate Content
Hi Richard, this functionality is not working with mobile app. is there a fix for that?
thanks
- Move Comment
- Delete Comment
- Mark as Read
- Mark as New
- Bookmark
- Permalink
- Report Inappropriate Content
Hi Prana,
If you're referring to the mobile offline iOS app (in the June 2017 release) then I do not think this will work as I don't think extensions are supported. However, using QS through a mobile browser should not have any limitations.
Hope this helps.
Richard
- Move Comment
- Delete Comment
- Mark as Read
- Mark as New
- Bookmark
- Permalink
- Report Inappropriate Content
Thanks Richard-
Whats is the update you made to this? I didnt quite follow. Apologies about that.
Also I had an other qn, I was trying to write an expression while choosing the data item as a variable.
Interview level has 3 values lets day x,y,z
I want to exclude 'y' and show only 'x' and 'z' on my axis. I do not want to write the code while loading my data,Is there a way I can do it here in the fx window?.
thanks
- Move Comment
- Delete Comment
- Mark as Read
- Mark as New
- Bookmark
- Permalink
- Report Inappropriate Content
Hi Prana, there are times when this update seems to happen but there are no changes.
Re your question on excluding values.
You can make the value you pass be a calculated dimension, e.g. If( [Field] <> 'y',[Field]) . You do not need an else value as this will default as Null. You should then set the dimension on the object to not show nulls (uncheck show nulls checkbox on the chart dimension).
Hope this helps.
Richard
- Move Comment
- Delete Comment
- Mark as Read
- Mark as New
- Bookmark
- Permalink
- Report Inappropriate Content
Of course it helps Richard. I see that I have to write this code on the chart dimensions..I was trying to write the code on the variables dimensions I added. so I just have to keep adding all the values I dont want to see.
ex: if ([field]<>('x,y...etc ') then field)
thankyou.
- Move Comment
- Delete Comment
- Mark as Read
- Mark as New
- Bookmark
- Permalink
- Report Inappropriate Content
Yes. However, you need to keep in mind that you should be explicit for each value and if you have more than one you will need to write a series of nested if statements. E.g.
IF([Field] = 'X', NULL(),
IF([Field] = 'Z', NULL(),
IF([Field] = 'A', NULL(),
IF([Field] = 'B', NULL(), [Field]
))))
The alternative is to add a flag against these fields into the dataload (perhaps using an inline table) so that you have a much easier expression such as IF([ExcludeFlag] <> 'Y', [Field])
- Move Comment
- Delete Comment
- Mark as Read
- Mark as New
- Bookmark
- Permalink
- Report Inappropriate Content
Okay thankyou !
- Move Comment
- Delete Comment
- Mark as Read
- Mark as New
- Bookmark
- Permalink
- Report Inappropriate Content
Awesome, I'm gonna use this for sure
Thank you!