Unlock a world of possibilities! Login now and discover the exclusive benefits awaiting you.
- Qlik Community
- :
- Forums
- :
- Forums by Product
- :
- Products (A-Z)
- :
- Qlik Sense
- :
- Documents
- :
- Introduction to Set Analysis (video) - Part 1
- Move Document
- Delete Document
- Subscribe to RSS Feed
- Mark as New
- Mark as Read
- Bookmark
- Subscribe
- Printer Friendly Page
- Report Inappropriate Content
Introduction to Set Analysis (video) - Part 1
- Move Document
- Delete Document and Replies
- Mark as New
- Bookmark
- Subscribe
- Mute
- Subscribe to RSS Feed
- Permalink
- Report Inappropriate Content
Introduction to Set Analysis (video) - Part 1
Mar 3, 2015 5:40:23 PM
Mar 3, 2015 5:40:23 PM
This video gets right to the point and shows you how to get started with Set Analysis. There are various blogs and articles on this topic that go in deeper, but I suggest you start here first.
Also consider this post by hic Natural Sets
Next Video: Set Analysis - Part 2 - Cool Stuff You Can Do (video)
- Move Comment
- Delete Comment
- Mark as Read
- Mark as New
- Bookmark
- Permalink
- Report Inappropriate Content
Hi Josephine this is correct - you could have 2 chart objects with different expressions. 1 displaying the total sum for everything and 1 displaying the restricted sum or defined value for the SET.
For example - Sum(Sales) - will take in account any selection and all of the data - this is default behavior - Sum({$<Year={2014}>}Sales) for example - will limit Sales to just 2014 - BUT will take in consideration OTHER dimension selections you may have on the interface. Sum({1<Year={2014}>}Sales) - will only show sales for 2014 regardless of (or ignoring) OTHER selections you may have on the interface.
You may also like this document: Set Analysis: syntaxes, examples
HTH
Mike T
Qlik
- Move Comment
- Delete Comment
- Mark as Read
- Mark as New
- Bookmark
- Permalink
- Report Inappropriate Content
This a good video to get familiar with Set Analysis
- Move Comment
- Delete Comment
- Mark as Read
- Mark as New
- Bookmark
- Permalink
- Report Inappropriate Content
I would like the content of this video on paper and you insist with these low quality-videos.
Make a change write a PDF.
CB:
- Move Comment
- Delete Comment
- Mark as Read
- Mark as New
- Bookmark
- Permalink
- Report Inappropriate Content
Hi Car Bal, if it came to a choice of just one medium, I would prefer the video.
There is a "paper" on se analysis here: Set Analysis: syntaxes, examples
Jo
- Move Comment
- Delete Comment
- Mark as Read
- Mark as New
- Bookmark
- Permalink
- Report Inappropriate Content
The quality looks pretty good to me.I don't think I want to watch Set Analysis at 1080p J
- Move Comment
- Delete Comment
- Mark as Read
- Mark as New
- Bookmark
- Permalink
- Report Inappropriate Content
Hi Car - we appreciate your feedback, do note that in part 2 of the video:Set Analysis - Part 2 - Cool Stuff You Can Do (video) - there is a section under the video that links to a PDF document. However, watching this video first is recommended before diving deeper into that document.
The section is marked as:
NOTE: For a more complete and deeper dive of Set Analysis check out this excellent document: Set Analysis: syntax, examples
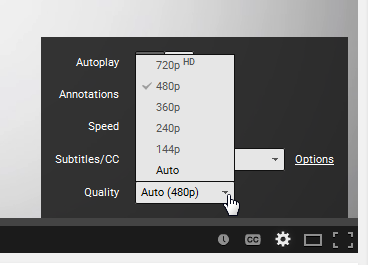
In regards to video quality - it depends on your bandwidth and where you ware watching the video. In order to increase the quality, click on the YouTube logo in the bottom right of the embedded player, and you will be brought directly to the YouTube site - the player interface will have options to improve the quality:
Regards,
Mike Tarallo
Qlik
- Move Comment
- Delete Comment
- Mark as Read
- Mark as New
- Bookmark
- Permalink
- Report Inappropriate Content
Hi Mike,
This video is very intuitive and has certainly given me a much better understanding of set analysis. I'm very new to SQL and QlikView so this is a great help. Couldn't say much more than thanks a great deal!
I do have a 'small' question though......
I have a chart with complex expressions which I need to write a set analysis expression for such that it selects two parameters from a list which is. These two parameters are specifically associated with a particular location, a date selection variable and is able to compare the result with a target and therefore display it as a pass or fail. Complex?
An example of the expression is........
sum({$<TargetExists={1},$(vSAContractualDateSelections),[Dashboard Parameter]={'$(=maxstring({$}[Dashboard Parameter]))'} >}ResultsNum)
I've tried to change it to
sum({<Site={'Area1'},TargetExists={1},$(vSAContractualDateSelections),[Dashboard Parameter]={'EDTA'} >}ResultsNum)
..... but it doesn't seem to work.
Any ideas please?
- Move Comment
- Delete Comment
- Mark as Read
- Mark as New
- Bookmark
- Permalink
- Report Inappropriate Content
Hi Mike - that is great to hear. In regards to your question, please post that here New to QlikView so you can get an appropriate response.
Please attach the example if you can, when posting - this will give those helping more context on what you are attempting to do.
Regards,
Mike T
- Move Comment
- Delete Comment
- Mark as Read
- Mark as New
- Bookmark
- Permalink
- Report Inappropriate Content
Thanks Mike! 
- Move Comment
- Delete Comment
- Mark as Read
- Mark as New
- Bookmark
- Permalink
- Report Inappropriate Content
Hi Michael
This video was very good.
I am looking for sample data with scenario to practice set analysis
Thanks in advance
Regards,
Gowthami