Unlock a world of possibilities! Login now and discover the exclusive benefits awaiting you.
- Qlik Community
- :
- Blogs
- :
- Technical
- :
- Support Updates
- :
- All you need to know about deploying the Qlik Sens...
- Subscribe to RSS Feed
- Mark as New
- Mark as Read
- Bookmark
- Subscribe
- Printer Friendly Page
- Report Inappropriate Content
Today I will try to answer and clarify the following question you may have
What and how many are they?
How does the Reload work?
Setup and configuration
What and how many are they?
In total, and as of now, there are 5 monitoring applications. Yes 5! Two of them are already imported in Qlik Sense after the installation and three others waiting to be manually imported in C:\Programdata\Qlik\Sense\Repository\DefaultApps
Operation Monitor: Gives you a global overview of your environment’s healthiness. There you can find information about error and warning reported in the logs, task reloads, resource consumption, active users and more
License Monitor: Give you a global overview of your license usage helping you to manage license allocation more efficiently.
Log Monitor: An application going deep dive into your Qlik Sense logs to help you better understand what is happening in your environment.
Reloads Monitor: Will let you understand exactly how your applications are being reloaded, how often, how long, on which nodes and how successful those reloads are.
Session Monitor: Who is using your applications, when, where and how often. This application will also help you to understand which apps are popular or not in your environment.
How does the Reload work?
To display the relevant information, the Monitoring Applications are loading data from two data sources; The logs and the database.
As of Qlik Sense September 2017, it is now possible to store the logs into PostgreSQL database (Centralized logging) and/or files. If Centralized Logging has been configured in your environment, it will fetch the data from there. If it’s not configured or for some reason not accessible, it will load the data from the files.
Once loaded that information will be stored into a QVD file in C:\Programdata\Qlik\Sense\Log on the node doing the reload.
Each monitoring application is generating its own set of QVDs:
Operation Monitor: governance_date_time_ops_version.qvd, governance_time_range_ops_version.qvd
License Monitor: governanceLicenseLog_version.qvd and governanceSession_version.qvd
and governanceLogContent_version_file.qvd
Log Monitor: governanceLogMonitor_version.qvd
Reload Monitor: reloadsMonitorLogContent_version.qvd
Sessions Monitor: sessionsMonitorLogContent_version.qvd
In addition, for some of those QVD's you will see an extension _file or _db. and it depends from which source the monitoring applications are loading the data from. (Centralized logging or files)
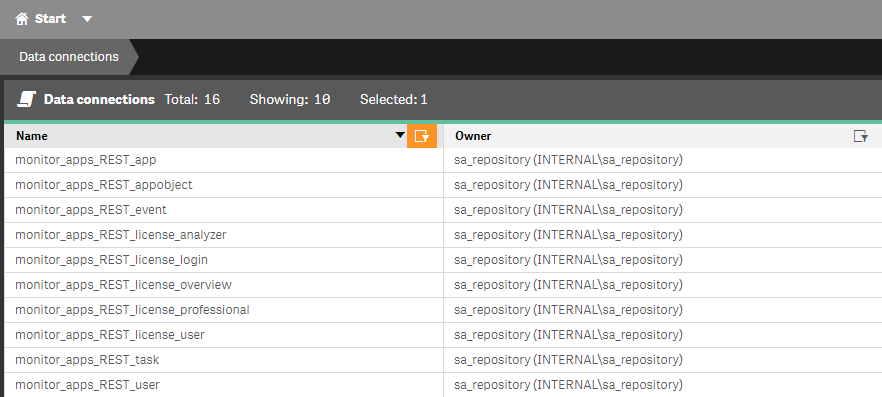
Finally, to load data from the database, the Monitoring Applications are using a set of Rest Connector data connections. Those are used to load different information such as users, applications, application objects, tasks, license, …
Setup and configuration
Depending if you are running a single or multi-node environment and using Centralized Logging or not there are several steps to ensure the Monitoring Applications will fetch all the data in your environment.
I would suggest following the steps described here. Please make sure to select the correct version at the top right
Once you have set up everything according to the link above depending on your environment, I’ll drive you through a couple of useful setting allowing you to customize your Monitoring Applications.
If you open the Script Load Editor for any of the Monitoring Applications (You will need to create an unpublish copy the application to do that)
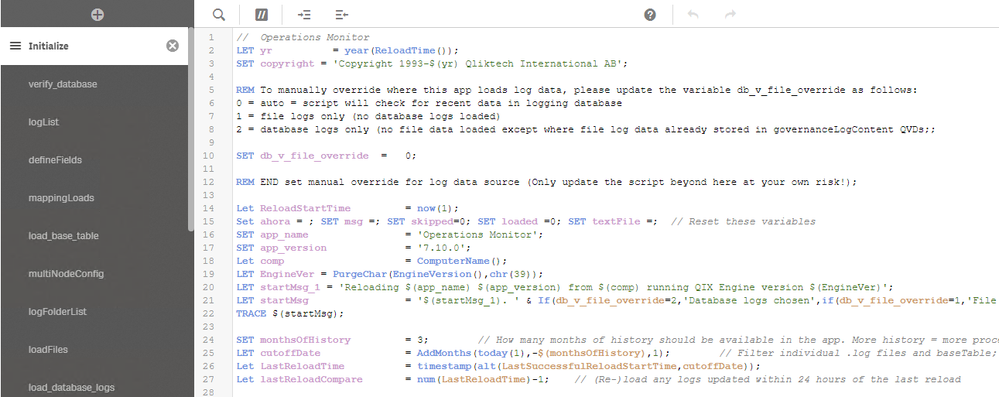
In the first tab called Initialize, you will find two useful settings
SET db_v_file_override = 0; (line 10)
And
SET monthsOfHistory = 3; (line 24)
db_v_file_override: This variable defines which data source the application will use to loads its data. (Centralized Logging or Log files)
By default, this is set to 0 meaning that the application will check connectivity toward the Centralized Logging database and if it works it will load data from there. If it doesn’t then it will load from the log files.
By setting it to 1 you will force the application to load from log files and by setting it to 2 you will force it to load from the Centralized Logging.
monthsOfHistory: This variable control how much history will be available in the application. The default is 3 but you can increase/decrease it.
Keep in mind that more history available equal more data to load and process so it will increase time and resource consumption.
If you do any change in the script, don’t forget to publish the application again in the Monitoring Apps stream.
Finally, in a multi-node environment, by default, the Monitoring Apps will only be available on the Central Node.
This means that if you have a dedicated scheduler rim node or want to open those applications in the hub from a rim node, it won’t work.
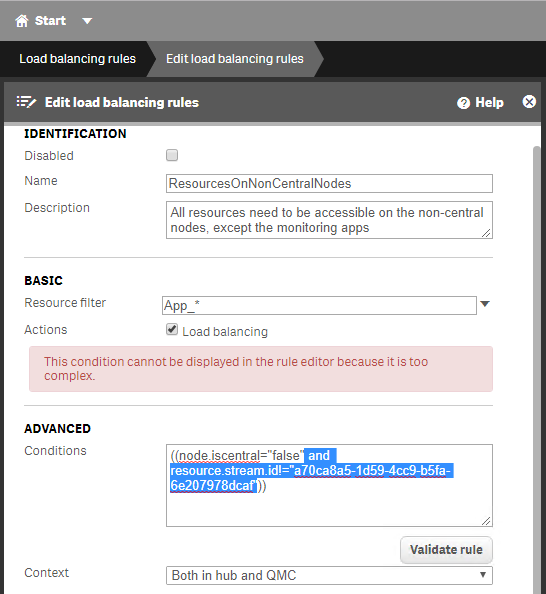
This is control by the load balancing rule called ResourcesOnNonCentralNodes.
Basically, this default rule says that every application will be accessible on every node, but the ones published in the Monitoring Apps stream.
To get rid of that you can, for instance, remove the highlighted text in the Conditions box which will make the Monitoring Applications available on every node or you can even custom the rule so that they are available on specific rim node(s) only.
Hope this will be clear and useful for hopefully many of you and don’t hesitate to like, comment and share (I will try to answer ALL your questions)
- « Previous
-
- 1
- 2
- Next »
You must be a registered user to add a comment. If you've already registered, sign in. Otherwise, register and sign in.


