Unlock a world of possibilities! Login now and discover the exclusive benefits awaiting you.
- Qlik Community
- :
- All Forums
- :
- QlikView App Dev
- :
- Assign correct Range values in a chart
- Subscribe to RSS Feed
- Mark Topic as New
- Mark Topic as Read
- Float this Topic for Current User
- Bookmark
- Subscribe
- Mute
- Printer Friendly Page
- Mark as New
- Bookmark
- Subscribe
- Mute
- Subscribe to RSS Feed
- Permalink
- Report Inappropriate Content
Assign correct Range values in a chart
Hello,
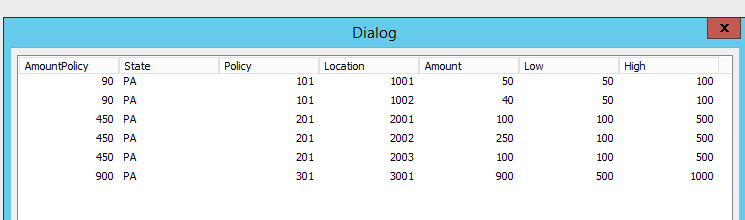
Below is an example of my data set and what the final result should look like.
Policy 101 includes 2 locations and sum of Policy 101 = 50 + 40 = 90 which should be on 50-100 band
Policy 201 includes 3 locations and sum of Policy 201 = 100+250+100 = 450 which should be on 100-500 band
Policy 301 includes 1 location and sum of Policy 301 = 900 which should be on 500-1000 band
I also attached the qvw but the values are not being assigned to the correct band (range).
Any suggestions ?
| Data Set | |||
| State | Policy | Location | Amount |
| PA | 101 | 1001 | 50 |
| PA | 101 | 1002 | 40 |
| PA | 201 | 2001 | 100 |
| PA | 201 | 2002 | 250 |
| PA | 201 | 2003 | 100 |
| PA | 301 | 3001 | 900 |
| Result | ||||
| Low | High | State | Policy | Amount |
| 0 | 50 | PA | 0 | 0 |
| 50 | 100 | PA | 101 | 90 |
| 100 | 500 | PA | 201 | 450 |
| 500 | 1000 | PA | 301 | 900 |
Accepted Solutions
- Mark as New
- Bookmark
- Subscribe
- Mute
- Subscribe to RSS Feed
- Permalink
- Report Inappropriate Content
I think you should do IntervalMatch for grouped Amount at Policy level:
DATA:
LOAD *
INLINE [
State, Policy, Location, Amount
PA, 101, 1001, 50
PA, 101, 1002, 40
PA, 201, 2001, 100
PA, 201, 2002, 250
PA, 201, 2003, 100
PA, 301, 3001, 900
];
left join(DATA)
LOAD
State, Policy, sum(Amount) as AmountPolicy
Resident DATA
group by State, Policy;
BAND:
LOAD *
INLINE [
Low, High
0, 50
50, 100
100, 500
500, 1000
];
JOIN (DATA)
IntervalMatch(AmountPolicy)
LOAD
*
RESIDENT BAND;
DROP TABLE BAND;
- Mark as New
- Bookmark
- Subscribe
- Mute
- Subscribe to RSS Feed
- Permalink
- Report Inappropriate Content
you can use interval match function.
- Mark as New
- Bookmark
- Subscribe
- Mute
- Subscribe to RSS Feed
- Permalink
- Report Inappropriate Content
In the current data set, is it possible to keep the table structure even though there's no data? Please see expected data set vs What's going on. When an appropriate filter is selected (let's say CITY for example), it drops the first two rows.
I tried using NULLASVALUE function but that didn't work.
SET NULLASVALUE = 'NULL';
NULLASVALUE *;
I also flipped the order but same result:
NULLASVALUE *;
SET NULLASVALUE = 'NULL';
Current Data Set
| Low | High | State | Policy | Amount |
| 0 | 50 | PA | 0 | 0 |
| 50 | 100 | PA | 101 | 90 |
| 100 | 500 | PA | 201 | 450 |
| 500 | 1000 | PA | 301 | 900 |
Expected Data Set:
| Low | High | State | Policy | Amount |
| 0 | 50 | |||
| 50 | 100 | |||
| 100 | 500 | PA | 201 | 450 |
| 500 | 1000 | PA | 301 | 900 |
What's going on:
| Low | High | State | Policy | Amount |
| 100 | 500 | PA | 201 | 450 |
| 500 | 1000 | PA | 301 | 900 |
- Mark as New
- Bookmark
- Subscribe
- Mute
- Subscribe to RSS Feed
- Permalink
- Report Inappropriate Content
It is not possible to see more than in your data model. You don't have zero values. IntervalMatch did not create ranges with nulls. You can try create another set of data with dummy ranges with zeros in Load Script.