Unlock a world of possibilities! Login now and discover the exclusive benefits awaiting you.
- Qlik Community
- :
- All Forums
- :
- QlikView App Dev
- :
- Re: Average of a Count
- Subscribe to RSS Feed
- Mark Topic as New
- Mark Topic as Read
- Float this Topic for Current User
- Bookmark
- Subscribe
- Mute
- Printer Friendly Page
- Mark as New
- Bookmark
- Subscribe
- Mute
- Subscribe to RSS Feed
- Permalink
- Report Inappropriate Content
Average of a Count
I want to create a chart where by I count the number of occasions an event has occurred in a given month, based on this count I want to display the average per month over a years period - does anyone know how to perform an Average of a Count
I.E,
3 events in Jan
5 events in Feb
4 events in Mar
Count would return = 12 but the I want to average this result being 4?
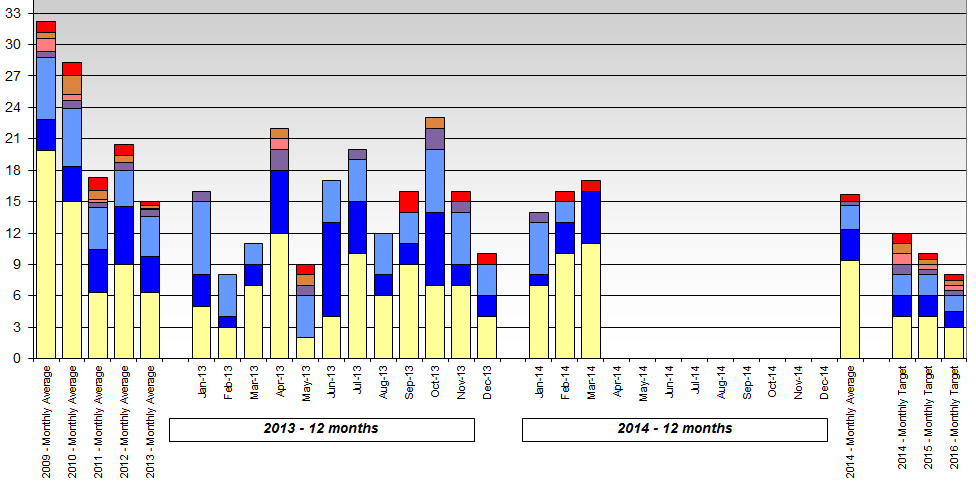
Ideally I would then want to show this on a chart so I got the average number of events per year for previous years i.e. 09, 10, 11, 12
And then broken down by month for 2013 and 2014 year to date - any help is welcome
- Mark as New
- Bookmark
- Subscribe
- Mute
- Subscribe to RSS Feed
- Permalink
- Report Inappropriate Content
Count(events)/Count(Month)
if you provide data, would be easy to answer.
- Mark as New
- Bookmark
- Subscribe
- Mute
- Subscribe to RSS Feed
- Permalink
- Report Inappropriate Content
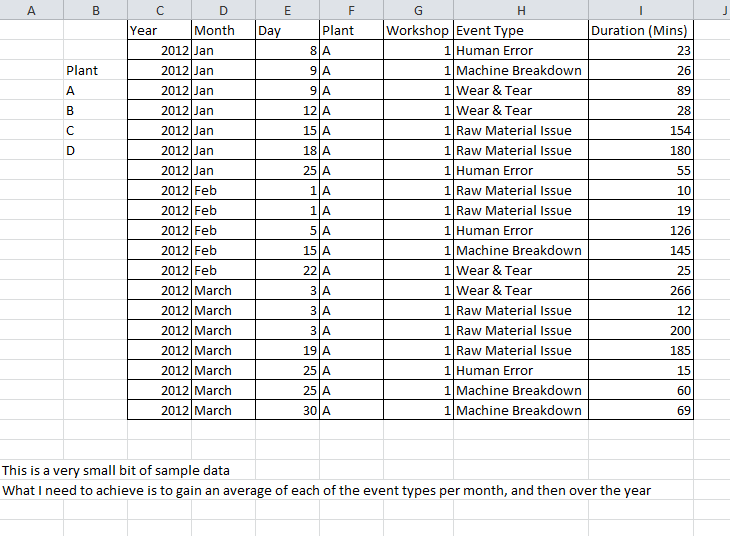
They are only Counts though - Basically I have to count the number of events on a production line
My attempt is something like this but it is not correct:
AVG (StopType_Label) when Year = "2009
AVG - is the caluclation
StopType_Label is the the data column - but I don't think I can perform the average function when the column is text, but I can count the number of occurrences
Year = another column of data
2009 - a piece of data that should be in the year column
- Mark as New
- Bookmark
- Subscribe
- Mute
- Subscribe to RSS Feed
- Permalink
- Report Inappropriate Content
Provide sample data along with your requirements. Would love to help you in this problem.
- Mark as New
- Bookmark
- Subscribe
- Mute
- Subscribe to RSS Feed
- Permalink
- Report Inappropriate Content
So I need to record a count per month, but then plot on a graph with averages for previous years, the current average per month for the year to date as well as targets.
Is this possible?

- Mark as New
- Bookmark
- Subscribe
- Mute
- Subscribe to RSS Feed
- Permalink
- Report Inappropriate Content
you could use rangesum etc with a variable to dictate which view you would like i.e. 1 month or a year
- Mark as New
- Bookmark
- Subscribe
- Mute
- Subscribe to RSS Feed
- Permalink
- Report Inappropriate Content
Hi Felim,
Thanks for the reply, I am a newbie to this - could you provide al little more detail.
It's getting the correct syntax etc... that I am struggling with