Unlock a world of possibilities! Login now and discover the exclusive benefits awaiting you.
- Qlik Community
- :
- All Forums
- :
- QlikView App Dev
- :
- Re: Avg Sales Quarter and month
- Subscribe to RSS Feed
- Mark Topic as New
- Mark Topic as Read
- Float this Topic for Current User
- Bookmark
- Subscribe
- Mute
- Printer Friendly Page
- Mark as New
- Bookmark
- Subscribe
- Mute
- Subscribe to RSS Feed
- Permalink
- Report Inappropriate Content
Avg Sales Quarter and month
How to calculate avg Sales for Quarter and Month
- Mark as New
- Bookmark
- Subscribe
- Mute
- Subscribe to RSS Feed
- Permalink
- Report Inappropriate Content
If you would like the results per Quarter (Q1, Q2...) or per Month (Jan, Feb,...) - this is not possible with a gauge object as you cannot use dimensions. Use a bar or line chart instead...or a gauge chart for each value of your dimension (one gauge for Q1, one for Q2...)
- Mark as New
- Bookmark
- Subscribe
- Mute
- Subscribe to RSS Feed
- Permalink
- Report Inappropriate Content
Considering that you already have master calendar or quarter field in your script....
if not, use below expression to create a Quarter Field
'Q' & CEIL(Month(Date(InvoiceDate))/3) as Quarter
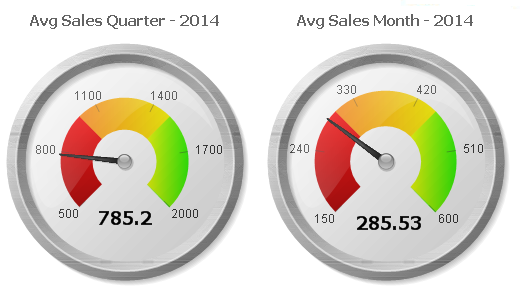
Now u can get the average sales per quarter and per month for year 2014 as below in GaugeChart
=AVG(Aggr(SUM({<Year= {'$(=Year(Today()))'}>}Sales),Quarter))
=AVG(Aggr(SUM({<Year = {'$(=Year(Today()))'}>}Sales),Month))
Make sure to change the Min and Max of Gauge Chart from Presentation layer with
Min
0
max
SUM(Sales0