Unlock a world of possibilities! Login now and discover the exclusive benefits awaiting you.
- Qlik Community
- :
- All Forums
- :
- QlikView App Dev
- :
- Bar Chart
- Subscribe to RSS Feed
- Mark Topic as New
- Mark Topic as Read
- Float this Topic for Current User
- Bookmark
- Subscribe
- Mute
- Printer Friendly Page
- Mark as New
- Bookmark
- Subscribe
- Mute
- Subscribe to RSS Feed
- Permalink
- Report Inappropriate Content
Bar Chart
Hello Community,
Looking for help on a way to sort and color a graph. Here is my user's request:
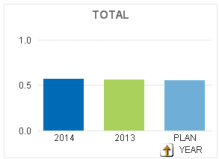
They would like the graph initially sorted by 2014, Plan, 2013. Then, they would like to be able to drill down to month. Using the sort functions I have not been able to meet both requirements. I figure it will take an expression, but I cannot think of one.
They have given me three colors for the initial view, but would like a calculated blue for the drill down months. I tried an if statement for background color - if(MONTH>=1, RGB(0,106,182)) which work properly unless the user selects a month, then it colors the year all the same color. Is there a dimensionality function with using the drill down field I am using (time)?
- Tags:
- new_to_qlikview
- sort
Accepted Solutions
- Mark as New
- Bookmark
- Subscribe
- Mute
- Subscribe to RSS Feed
- Permalink
- Report Inappropriate Content
Regarding sorting, you could either add a sorting field in the script (value 1 for 2013, 2 for PLAN and 3 for 2014) and then sort by that field in the sort expression. Alternatively use something like this as sort expression: WildMatch(YEAR, '2013', 'PLAN', '2014')
- Mark as New
- Bookmark
- Subscribe
- Mute
- Subscribe to RSS Feed
- Permalink
- Report Inappropriate Content
hi,
this may prove useful:
- Mark as New
- Bookmark
- Subscribe
- Mute
- Subscribe to RSS Feed
- Permalink
- Report Inappropriate Content
Regarding sorting, you could either add a sorting field in the script (value 1 for 2013, 2 for PLAN and 3 for 2014) and then sort by that field in the sort expression. Alternatively use something like this as sort expression: WildMatch(YEAR, '2013', 'PLAN', '2014')
- Mark as New
- Bookmark
- Subscribe
- Mute
- Subscribe to RSS Feed
- Permalink
- Report Inappropriate Content
Kristofer,
Thanks the WildMatch worked great. Could you show me how to put a sorting field into the script. Would that be like an inline table such as:
Year Value
2014 1
Plan 2
2013 3
Thank you in advance for the help.
- Mark as New
- Bookmark
- Subscribe
- Mute
- Subscribe to RSS Feed
- Permalink
- Report Inappropriate Content
That depends on your current data model I would say. I assume that YEAR is a field in a bigger table?
In that case you could do something like this during the LOAD of that table:
LOAD
Fieldname 1,
Fieldname 2,
YEAR,
if(YEAR = '2013', '1', if(YEAR = 'PLAN', '2', if(YEAR = '2013', '3'))) as YearSort,
Fieldname 4
FROM....
Alternatively you might use an inline table just a you say
LOAD * INLINE [
Year, YearSort
2013, 1
2014, 3
Plan, 2
];
Then simply put YearSort as the sort expression.
- Mark as New
- Bookmark
- Subscribe
- Mute
- Subscribe to RSS Feed
- Permalink
- Report Inappropriate Content
Yes YEAR is in a bigger table, that is linked to another table. Is that why you put Year into the inline script? So it didn't connect due to not being capitalized. What problems would this cause if it was connected?
- Mark as New
- Bookmark
- Subscribe
- Mute
- Subscribe to RSS Feed
- Permalink
- Report Inappropriate Content
Sorry, that was my mistake. YEAR should be capitalized if you use the inline table approach (provided of course that it is capitalized in the other table). They need to be connnected in order for the sort to work.
Which approach you use might also depend on the amount of data you have in the table. Say e.g. your bigger table has several hundred thousand rows. Then adding a new sorting field might degrade performance. On the other hand, using the separate inline table clutters your data model...
- Mark as New
- Bookmark
- Subscribe
- Mute
- Subscribe to RSS Feed
- Permalink
- Report Inappropriate Content
Perfect thank you for the great help!!