Unlock a world of possibilities! Login now and discover the exclusive benefits awaiting you.
- Qlik Community
- :
- All Forums
- :
- QlikView App Dev
- :
- Re: Bar Graph
- Subscribe to RSS Feed
- Mark Topic as New
- Mark Topic as Read
- Float this Topic for Current User
- Bookmark
- Subscribe
- Mute
- Printer Friendly Page
- Mark as New
- Bookmark
- Subscribe
- Mute
- Subscribe to RSS Feed
- Permalink
- Report Inappropriate Content
Bar Graph
Hi there,
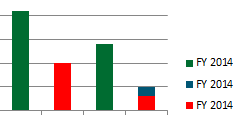
Does anyone know if it is possible to create bar graph with 3 variables, where 2 of them will be presented stacked, and the third will be grouped. As on the picture, if both red and blue present they will be stacked, and green grouped to them.
Please advise if this is possible to do.
Thank you-
Accepted Solutions
- Mark as New
- Bookmark
- Subscribe
- Mute
- Subscribe to RSS Feed
- Permalink
- Report Inappropriate Content
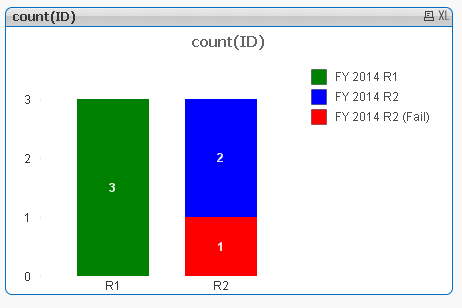
Please find an example attached. This kind of problem is all about the scripting and not so much about the chart type. I hope the example provides you with an idea...you might do some amendment depending of how your data exactly looks like.
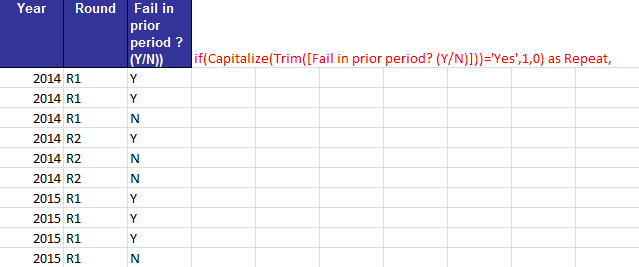
Basically you create a new dimension that shows what you are aiming for (Value 1: green, Value 2: blue and Value 3: red). Therefore you load your source data twice and concatenate them: once for the green-value (where I dont take Fail into account...so this =Null ) and then a second load where I create the other two values. The expression is then a simple count() ...in my example I added a distinct ID-field.
Data:
LOAD * INLINE [
Year, Round, Fail, ID
2014, R1, Y, 1
2014, R1, Y, 2
2014, R1, N, 3
2014, R2, Y, 4
2014, R2, N, 5
2014, R2, N, 6
2015, R1, Y, 7
2015, R1, Y, 8
2015, R1, Y, 9
2015, R1, N, 10
];
Data2:
LOAD
'R1' as Dim1,
Year,
Round,
ID,
'FY 2014 R1' as Dim2
Resident Data Where Year=2014 and Round='R1';
Data3:
LOAD
'R2' as Dim1,
Year,
Round,
Fail,
if(Round='R2' and Fail='Y','FY 2014 R2 (Fail)', if(Round='R2' and Fail='N','FY 2014 R2')) as Dim2,
ID
Resident Data Where Year=2014 and Round='R2';
DROP Table Data;
- Mark as New
- Bookmark
- Subscribe
- Mute
- Subscribe to RSS Feed
- Permalink
- Report Inappropriate Content
- Mark as New
- Bookmark
- Subscribe
- Mute
- Subscribe to RSS Feed
- Permalink
- Report Inappropriate Content
Check here:
- Mark as New
- Bookmark
- Subscribe
- Mute
- Subscribe to RSS Feed
- Permalink
- Report Inappropriate Content
Hi,
Hope this helps.
- Mark as New
- Bookmark
- Subscribe
- Mute
- Subscribe to RSS Feed
- Permalink
- Report Inappropriate Content
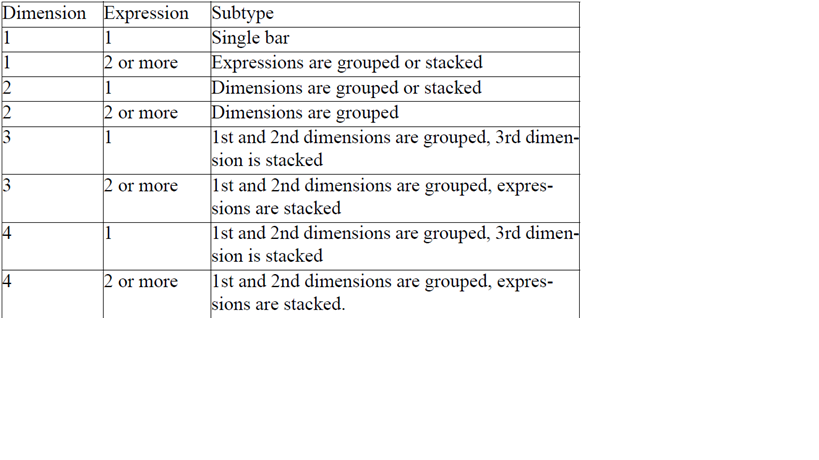
I think the chart will be (pretty) automatically like that if you have two proper dimension fields - so if R1 only has this one value in the second dimension and R2 has these 2 different segements of the 2nd dim (which cant be identified at the moment as both have the same label in your example - just that one is blue and the other one is red)....so it should work fine
- Mark as New
- Bookmark
- Subscribe
- Mute
- Subscribe to RSS Feed
- Permalink
- Report Inappropriate Content
Please post your data if you are not sure how to create the two dimensions.
- Mark as New
- Bookmark
- Subscribe
- Mute
- Subscribe to RSS Feed
- Permalink
- Report Inappropriate Content
Here is the sample data
- Mark as New
- Bookmark
- Subscribe
- Mute
- Subscribe to RSS Feed
- Permalink
- Report Inappropriate Content
So I guess green is always the count of Fails (Y) for R1? And what is blue and red supposed to show?
- Mark as New
- Bookmark
- Subscribe
- Mute
- Subscribe to RSS Feed
- Permalink
- Report Inappropriate Content
sorry for not clarifying.
Green is count for 2014 R1
Blue is 2014 R2 and N
Red is 2014 R2 and Y
2015 is not on the graph yet
- Mark as New
- Bookmark
- Subscribe
- Mute
- Subscribe to RSS Feed
- Permalink
- Report Inappropriate Content
Please find an example attached. This kind of problem is all about the scripting and not so much about the chart type. I hope the example provides you with an idea...you might do some amendment depending of how your data exactly looks like.
Basically you create a new dimension that shows what you are aiming for (Value 1: green, Value 2: blue and Value 3: red). Therefore you load your source data twice and concatenate them: once for the green-value (where I dont take Fail into account...so this =Null ) and then a second load where I create the other two values. The expression is then a simple count() ...in my example I added a distinct ID-field.
Data:
LOAD * INLINE [
Year, Round, Fail, ID
2014, R1, Y, 1
2014, R1, Y, 2
2014, R1, N, 3
2014, R2, Y, 4
2014, R2, N, 5
2014, R2, N, 6
2015, R1, Y, 7
2015, R1, Y, 8
2015, R1, Y, 9
2015, R1, N, 10
];
Data2:
LOAD
'R1' as Dim1,
Year,
Round,
ID,
'FY 2014 R1' as Dim2
Resident Data Where Year=2014 and Round='R1';
Data3:
LOAD
'R2' as Dim1,
Year,
Round,
Fail,
if(Round='R2' and Fail='Y','FY 2014 R2 (Fail)', if(Round='R2' and Fail='N','FY 2014 R2')) as Dim2,
ID
Resident Data Where Year=2014 and Round='R2';
DROP Table Data;