Unlock a world of possibilities! Login now and discover the exclusive benefits awaiting you.
- Qlik Community
- :
- All Forums
- :
- QlikView App Dev
- :
- Re: Chart / Table / List of Top Items
- Subscribe to RSS Feed
- Mark Topic as New
- Mark Topic as Read
- Float this Topic for Current User
- Bookmark
- Subscribe
- Mute
- Printer Friendly Page
- Mark as New
- Bookmark
- Subscribe
- Mute
- Subscribe to RSS Feed
- Permalink
- Report Inappropriate Content
Chart / Table / List of Top Items
Hello -
I have an application for restaurant sales. I have a dimension called [Major Group] that has fields such as 'Food' and 'Beer' and 'Liquor' and 'Wine'
I have another dimension called [Family Group] that has fields such as 'Burgers' and 'Draft Beer'
Finally, I have another dimension called [Menu Item] that has the specific menu item names 'Cheesburger' etc.
I have created a drill-down group that has the above hierarchy.
I want to either create a table or chart that displays the top 5 items from each Group if possible by sales [Total Sales] or volume [Sales Count]
Is there an efficient way to do this?
Accepted Solutions
- Mark as New
- Bookmark
- Subscribe
- Mute
- Subscribe to RSS Feed
- Permalink
- Report Inappropriate Content
Hi Evan,
Are you using QV or QSense?
Either Way its quite easy.
1. Create your drill down group.[Major Group - Family Group - Menu Item]
2. Use it as the dimension
3. Set the measure to Sum([Total Sales])
4. This is the important part --> Set your Limitations to show top 5 values only (see attached)

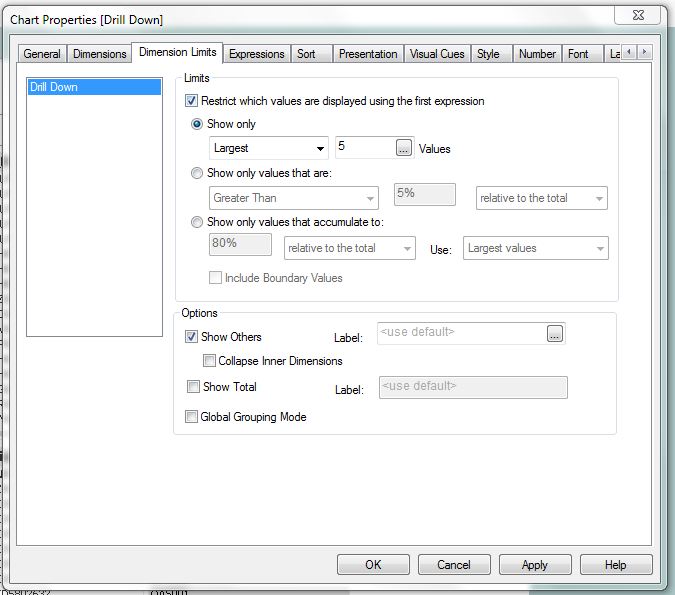
Let me know if it works.
Nico
- Mark as New
- Bookmark
- Subscribe
- Mute
- Subscribe to RSS Feed
- Permalink
- Report Inappropriate Content
Major Group - Family Group - Menu Item
TOP 5 means TOP 5 from Menu Item
or
TOP 5 Major Group's TOP 5 Family Group's Top 5 Menu Item?
- Mark as New
- Bookmark
- Subscribe
- Mute
- Subscribe to RSS Feed
- Permalink
- Report Inappropriate Content
Top 5 Menu Items within the Major Group.
So, if I pick 'Food' from my [Major Group] I want to see the top 5 items ([Menu Item]) from that.
Ultimately, I want to include this in a Qlikview report
- Mark as New
- Bookmark
- Subscribe
- Mute
- Subscribe to RSS Feed
- Permalink
- Report Inappropriate Content
Can you provide sample data in excel file to work?
If possible, also include the expected result you are looking for.
I would like to work on this!
- Mark as New
- Bookmark
- Subscribe
- Mute
- Subscribe to RSS Feed
- Permalink
- Report Inappropriate Content
Hi Evan,
Are you using QV or QSense?
Either Way its quite easy.
1. Create your drill down group.[Major Group - Family Group - Menu Item]
2. Use it as the dimension
3. Set the measure to Sum([Total Sales])
4. This is the important part --> Set your Limitations to show top 5 values only (see attached)
Let me know if it works.
Nico