Unlock a world of possibilities! Login now and discover the exclusive benefits awaiting you.
- Qlik Community
- :
- All Forums
- :
- QlikView App Dev
- :
- Re: Colours of bars in bar chart
- Subscribe to RSS Feed
- Mark Topic as New
- Mark Topic as Read
- Float this Topic for Current User
- Bookmark
- Subscribe
- Mute
- Printer Friendly Page
- Mark as New
- Bookmark
- Subscribe
- Mute
- Subscribe to RSS Feed
- Permalink
- Report Inappropriate Content
Colours of bars in bar chart
Hi,
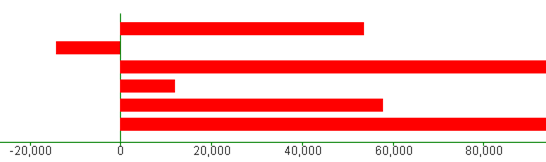
I have a bar chart which gives me a bar for the target of sales - actual sales in each department to see what the variance is.
If the bar in the chart is less than 0 i want it to be green and if the bar is greater that zero i want it to be red.
Can you tell me how to do this, this is a picture of the chart below.
So i want to make the second bar green as it is below 0.
Thanks
Laura
Accepted Solutions
- Mark as New
- Bookmark
- Subscribe
- Mute
- Subscribe to RSS Feed
- Permalink
- Report Inappropriate Content
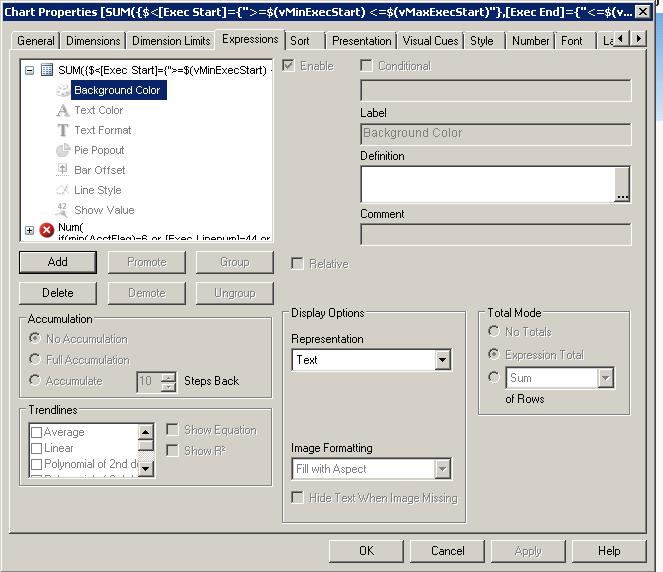
in expression tab on + icon of bar chart you ll see the backround color then click on it and put expression which you use for variance
in if condition
like
if(variance>0 ,lightred(),lightgreen ())
hope it helps
- Mark as New
- Bookmark
- Subscribe
- Mute
- Subscribe to RSS Feed
- Permalink
- Report Inappropriate Content
Hey Laura,
If you go to the expression tab and collapse the expression you can change the colour of the bars in the background colour item.
Do something like:
if(column(1)<0,green(),red())
Hopes this helps.
gr.
Frank
- Mark as New
- Bookmark
- Subscribe
- Mute
- Subscribe to RSS Feed
- Permalink
- Report Inappropriate Content
in expression tab on + icon of bar chart you ll see the backround color then click on it and put expression which you use for variance
in if condition
like
if(variance>0 ,lightred(),lightgreen ())
hope it helps
- Mark as New
- Bookmark
- Subscribe
- Mute
- Subscribe to RSS Feed
- Permalink
- Report Inappropriate Content
Hi,
See the below screen Short and attached file. You can able to add condition here