Unlock a world of possibilities! Login now and discover the exclusive benefits awaiting you.
- Qlik Community
- :
- All Forums
- :
- QlikView App Dev
- :
- Combining values from multiple dimensions in one a...
- Subscribe to RSS Feed
- Mark Topic as New
- Mark Topic as Read
- Float this Topic for Current User
- Bookmark
- Subscribe
- Mute
- Printer Friendly Page
- Mark as New
- Bookmark
- Subscribe
- Mute
- Subscribe to RSS Feed
- Permalink
- Report Inappropriate Content
Combining values from multiple dimensions in one axis
Hi everyone,
I am trying to combine the values from multiple dimensions into one single axis in a bar chart. I think it's easier to explain with an example.
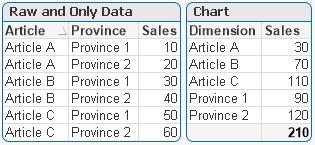
Let's say I have a data model with the sales of a company, and among others, I have geographical dimensions (let's say province) and product dimensions (let's say article). I can create two different bar charts, showing the total sales split among the different provinces and another one showing the sales split among articles. But is there any way I can mix the values of the two dimensions in the same graph? I also need to sort all the values by expression, regardless of whether it is a province or an article. So, for instance, what I want, in a table chart, should look like:
Dimension - Sum(Sales)
Province A - 10000
Province X - 9500
Article B - 8900
Province M - 8500
Article Z - 8000
Article D - 7000
Province B - 6500
Thank you for your help.
- Mark as New
- Bookmark
- Subscribe
- Mute
- Subscribe to RSS Feed
- Permalink
- Report Inappropriate Content
Jagan what do you think about a Link Table here? Do you think that can work?
- Mark as New
- Bookmark
- Subscribe
- Mute
- Subscribe to RSS Feed
- Permalink
- Report Inappropriate Content
Attached is one way to do it without touching the data model since you don't want to do that. I used $Field as a hidden dimension in the chart, then picked the right field based on the value of $Field. I believe it could be easily extended to as many dimensions as you want to use.
Edit: There's no reason for the hidden dimension of $Field. That does nothing for us.
Dimension 1: $Field
Dimension 2: =pick(match($Field,'Article','Province'),[Article],[Province])
Expression: sum(Sales)
- Mark as New
- Bookmark
- Subscribe
- Mute
- Subscribe to RSS Feed
- Permalink
- Report Inappropriate Content
Amazing idea
I am glad you are back 
- Mark as New
- Bookmark
- Subscribe
- Mute
- Subscribe to RSS Feed
- Permalink
- Report Inappropriate Content
That was genius. It works like a charm. Thank you very much!
- Mark as New
- Bookmark
- Subscribe
- Mute
- Subscribe to RSS Feed
- Permalink
- Report Inappropriate Content
With link table also we can achieve.
- Mark as New
- Bookmark
- Subscribe
- Mute
- Subscribe to RSS Feed
- Permalink
- Report Inappropriate Content
Good idea john.
- Mark as New
- Bookmark
- Subscribe
- Mute
- Subscribe to RSS Feed
- Permalink
- Report Inappropriate Content
johnw How to create a list box for this new dimension for selection? I made a list box with same expression =pick(match($Field,'Article','Province'),[Article],[Province])
but when I select in this list box, the bar chart says 'no data to display'.
Please advise.
Thanks,
BR,
SAK
- Mark as New
- Bookmark
- Subscribe
- Mute
- Subscribe to RSS Feed
- Permalink
- Report Inappropriate Content
Sorry for being so incredibly slow to get back to this.
Seems like our basic problem is that "When using more than one field as base for a calculated field, the logical implications of selections in the base fields or the calculated field may be quite complex." Complex, sure, but without any further explanation of how QlikView decides what you're trying to do with the underlying fields, I'm reduced to trial and error. In any case, the expression I suggested picks a single value for the field you click on, and ALL values for the other field. That's fine if you only select in one or the other, but if you select any values from both, you get ALL values from both. Not good.
Maybe a month back, I tried hard to find a data model solution for this, and failed. I have quite a few applications where I do something exactly like this. In all of them, there's an island dimension that I load all the values from both fields into. Then I have macros fired that go back and forth, keeping the island dimension and the two real dimensions in sync. I hate that utterly inelegant solution. Converting to actions without macros wouldn't really be much better. I want to replace that solution. So I gave it a shot and failed.
We can move a little of the complexity into the script by building a Seq field with values 1 and 2. I wanted to use valueloop, but "Purely synthetic calculated fields created via the valuelist and valueloop functions are not permitted." Anyway, then we can use:
pick(Seq,Article,Province)
But that works no better in a list box. Same behavior as the original expression. So we're looking for an expression that produces the full list, and for which QlikView interprets selections as desired. I poked at it for about an hour, and wasn't able to come up with anything. Either what I did disconnected the list box entirely from the actual fields, or the selection behavior was the same as the original expression.
So the only practical way to do it that I know of at this time is triggered actions or triggered macros working on an island field that combines the values of both fields. I hope someone comes up with something better.
- Mark as New
- Bookmark
- Subscribe
- Mute
- Subscribe to RSS Feed
- Permalink
- Report Inappropriate Content
Is there anyway we can have totals Articals (as line 4) and Province (last line) and if possible one empty row between both?
- Mark as New
- Bookmark
- Subscribe
- Mute
- Subscribe to RSS Feed
- Permalink
- Report Inappropriate Content
Is there anyway we can have totals Articals (as line 4) and Province (last line) and if possible one empty row between both?