Unlock a world of possibilities! Login now and discover the exclusive benefits awaiting you.
- Qlik Community
- :
- All Forums
- :
- QlikView App Dev
- :
- Re: Como Mover los datos de un grafico de Tarta?
- Subscribe to RSS Feed
- Mark Topic as New
- Mark Topic as Read
- Float this Topic for Current User
- Bookmark
- Subscribe
- Mute
- Printer Friendly Page
- Mark as New
- Bookmark
- Subscribe
- Mute
- Subscribe to RSS Feed
- Permalink
- Report Inappropriate Content
Como Mover los datos de un grafico de Tarta?
Holas Estimados,
Me estoy iniciando en QV y necesito saber como puedo mover los datos (las dimensiones) dentro del grafico de tarta,
eJ:
Los numeros del grafico de tarta van a la izquierda, quiero quiero que esten abajo a la derecha
Saludos y desde ya Muchas gracias!!
Esteban
Accepted Solutions
- Mark as New
- Bookmark
- Subscribe
- Mute
- Subscribe to RSS Feed
- Permalink
- Report Inappropriate Content
I don't think you can graphically influence this position. You would have to sort this dimension either with standard sorting methods (status, numeric, alphabetically, load order ...) or if this does not deliver the expected results then a special sorting expression could be used.
- Mark as New
- Bookmark
- Subscribe
- Mute
- Subscribe to RSS Feed
- Permalink
- Report Inappropriate Content
Hi Esteban,
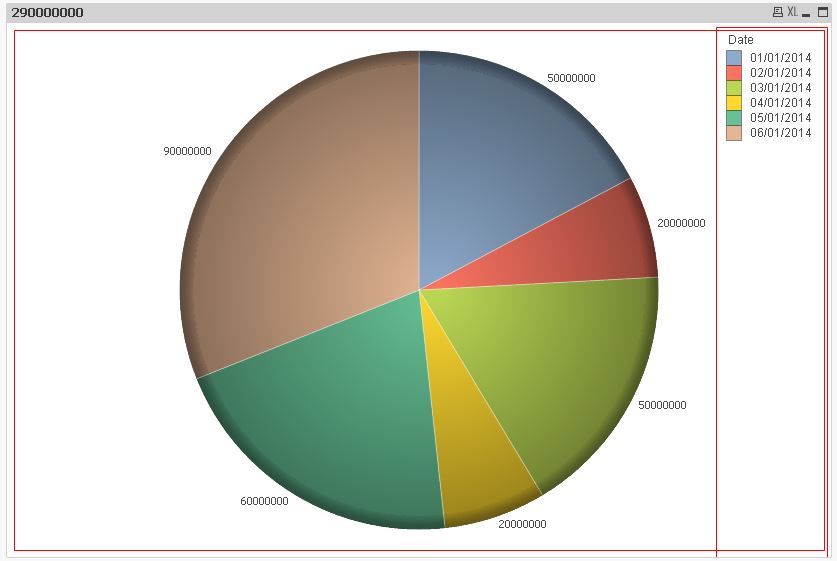
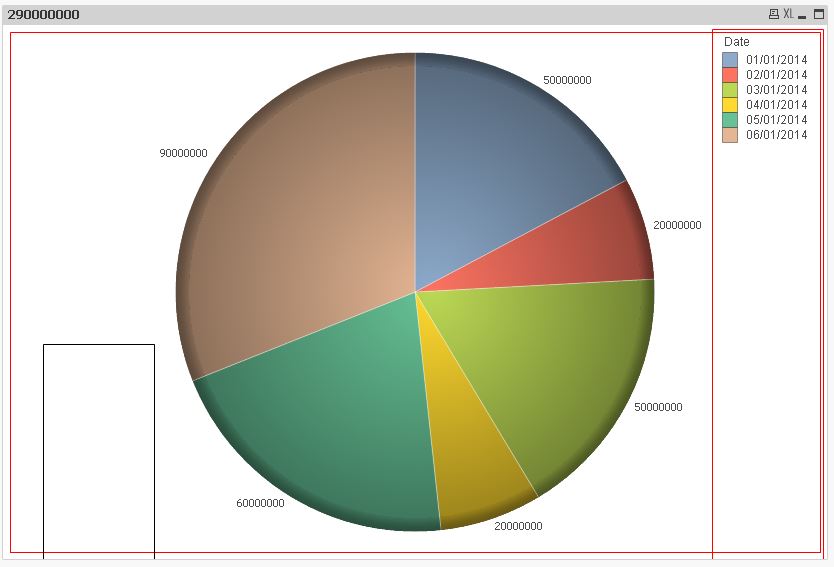
if you meand the legend values, then you can drag them to another position if you press CTRL+SHIFT while the chart is focused. Red borders then mark the position of the legend and the pie chart itself:

drag the legend to another position

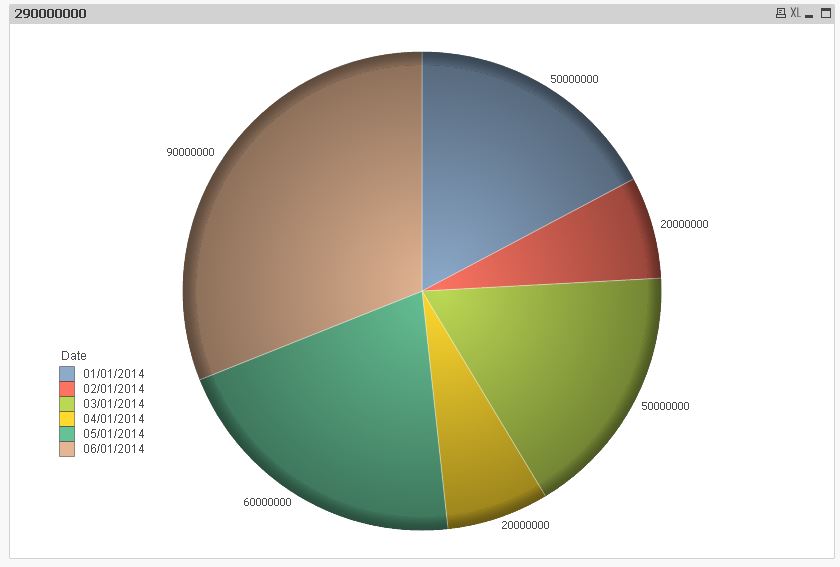
release CTRL+SHIFT to see the result

hope this helps
regards
Marco
- Mark as New
- Bookmark
- Subscribe
- Mute
- Subscribe to RSS Feed
- Permalink
- Report Inappropriate Content
Marco,
muchas gracias, aunque quizas no fue claro, pero no me referia a la leyenda si no a los datos del mismo grafico, es decir (tomando tu ejemplo) , que necesito mover de posicion la franja amarilla (200000000) y en vez de que este abajo, este arriba, ya aunque con tu respuesta podria solucionar mi problema..
Marco,
Marco,
thank you very much, but maybe I was not clear, but I was not referring to the legend, I mean to the data of the same graph, in other words(taking your example), I need to move to position the yellow strip (200000000) I mean, move the yellow strip to other position...
even with your solution I can do something,
Esteban
- Mark as New
- Bookmark
- Subscribe
- Mute
- Subscribe to RSS Feed
- Permalink
- Report Inappropriate Content
I don't think you can graphically influence this position. You would have to sort this dimension either with standard sorting methods (status, numeric, alphabetically, load order ...) or if this does not deliver the expected results then a special sorting expression could be used.
- Mark as New
- Bookmark
- Subscribe
- Mute
- Subscribe to RSS Feed
- Permalink
- Report Inappropriate Content
Thanks Marco...
I Tried sorting, and I see thats the only solution for my problem
Best Regards
Esteban
- Mark as New
- Bookmark
- Subscribe
- Mute
- Subscribe to RSS Feed
- Permalink
- Report Inappropriate Content
you're welcome
regards
Marco