Unlock a world of possibilities! Login now and discover the exclusive benefits awaiting you.
- Qlik Community
- :
- All Forums
- :
- QlikView App Dev
- :
- Re: Crossing the data
- Subscribe to RSS Feed
- Mark Topic as New
- Mark Topic as Read
- Float this Topic for Current User
- Bookmark
- Subscribe
- Mute
- Printer Friendly Page
- Mark as New
- Bookmark
- Subscribe
- Mute
- Subscribe to RSS Feed
- Permalink
- Report Inappropriate Content
Crossing the data
Hi All,
i have one table contains structure as follows
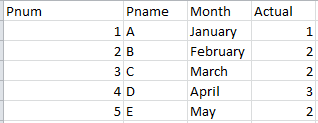
but my requirement is as follows
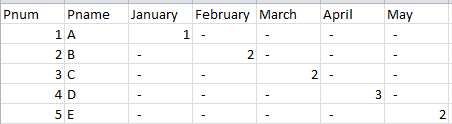
i'm attaching Excel files which contains data in Sheet1 and Sheet2.
Please somebody give me reply.
Thanks,
M V
- Tags:
- new_to_qlikview
- Mark as New
- Bookmark
- Subscribe
- Mute
- Subscribe to RSS Feed
- Permalink
- Report Inappropriate Content
1. Load the data as it is
2. Create a pivot table with Pnum, Pname and Month as dimensions and sum(Actual) as expression
3. Drag the Month dimension to the right to above the expression. Let go when you see a horizontal blue line.
You should now have a pivot table that resembles your requirement.
You'll need a small inline table to sort the months correctly too. See attached example.
talk is cheap, supply exceeds demand
- Mark as New
- Bookmark
- Subscribe
- Mute
- Subscribe to RSS Feed
- Permalink
- Report Inappropriate Content
Hi
Use Pivot table and drag and drop . PFA
Please close the thread by marking correct answer & give likes if you like the post.
- Mark as New
- Bookmark
- Subscribe
- Mute
- Subscribe to RSS Feed
- Permalink
- Report Inappropriate Content
I did this example, I hope you serve
- Mark as New
- Bookmark
- Subscribe
- Mute
- Subscribe to RSS Feed
- Permalink
- Report Inappropriate Content
If you want to do this at script level you could try something like this
Generic
LOAD Pnum,
     Pname,
     Month,
     Actual
FROM [Book1.xlsx](ooxml, embedded labels, table is Sheet1);


Load Distinct Month
FROM [Book1.xlsx] (ooxml, embedded labels, table is Sheet1);


set v='Noconcatenate Final:';
for t = 1 to FieldValueCount('Month')

    let tab ='Sheet1.'&FieldValue('Month',$(t));
    $(v)
    LOAD *
    Resident $(tab);
    set v='join(Final)';
    drop Table $(tab);
next