Unlock a world of possibilities! Login now and discover the exclusive benefits awaiting you.
- Qlik Community
- :
- All Forums
- :
- QlikView App Dev
- :
- Re: Current selection plus the last 6 months in Li...
- Subscribe to RSS Feed
- Mark Topic as New
- Mark Topic as Read
- Float this Topic for Current User
- Bookmark
- Subscribe
- Mute
- Printer Friendly Page
- Mark as New
- Bookmark
- Subscribe
- Mute
- Subscribe to RSS Feed
- Permalink
- Report Inappropriate Content
Current selection plus the last 6 months in Line Chart
Hi all,
I need to create a Line Chart where I would like to show the current selection and the last months too.
COUNT({$<aaa= {'xxx',''}>} aaa) i used this for the current selection but I would like to display the data for the last 6 months too.
Is this possible in set analysis?
Kind regards,
Constantin
Accepted Solutions
- Mark as New
- Bookmark
- Subscribe
- Mute
- Subscribe to RSS Feed
- Permalink
- Report Inappropriate Content
May be this? I assume, You have Neat Date Format
COUNT({$<aaa= {'xxx',''}, DateField = {">= $(=Date(AddMonths(Max(DateField),-6))) <=$(=Date(Max(DateField)))"}>} aaa)
- Mark as New
- Bookmark
- Subscribe
- Mute
- Subscribe to RSS Feed
- Permalink
- Report Inappropriate Content
May be this? I assume, You have Neat Date Format
COUNT({$<aaa= {'xxx',''}, DateField = {">= $(=Date(AddMonths(Max(DateField),-6))) <=$(=Date(Max(DateField)))"}>} aaa)
- Mark as New
- Bookmark
- Subscribe
- Mute
- Subscribe to RSS Feed
- Permalink
- Report Inappropriate Content
Can you provide more info or some sample data?
Is the current selection also the date? So you want all date from the currently selected date back 6 months?
Or some other dimension? If some other dimension do you want that selection PLUS the last 6 months ignoring the selection?
- Mark as New
- Bookmark
- Subscribe
- Mute
- Subscribe to RSS Feed
- Permalink
- Report Inappropriate Content
Hi,
The current selection are year and months.
I want to select them and after my line chart to show me the selection like year 2017 and month june plus 6 previews months.
Thank you
- Mark as New
- Bookmark
- Subscribe
- Mute
- Subscribe to RSS Feed
- Permalink
- Report Inappropriate Content
Then I think you need something very similar to what Anil provided. Assuming you have a DateField too.
Something like:
COUNT({$<YourYearField=,YourMonthField=, DateField = {">= $(=Date(AddMonths(Max(DateField),-6))) <=$(=Date(Max(DateField)))"}>} aaa)
- Mark as New
- Bookmark
- Subscribe
- Mute
- Subscribe to RSS Feed
- Permalink
- Report Inappropriate Content
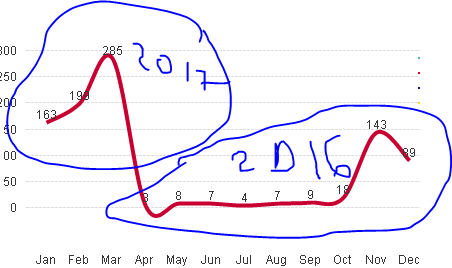
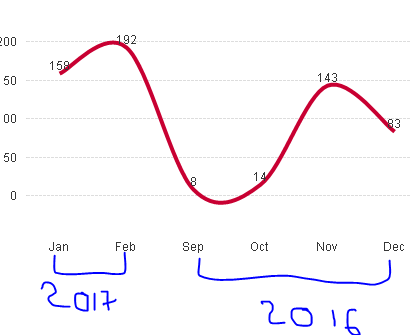
using the above code I achieved this, which is wrong
- Mark as New
- Bookmark
- Subscribe
- Mute
- Subscribe to RSS Feed
- Permalink
- Report Inappropriate Content
Thank for your answer but the above code doesn't work for me..
I created 2 columns like:
monthname(OrderDate) as CalendarPeriod
num(MonthName([OrderDate)) AS CalendarPeriodnum
plus I added this code to my expression :
count({$<aaa= {'xxx',''}, CalendarPeriodnum={'>= $(=num(MonthStart(AddMonths(max(CalendarPeriod),-5)))) <= $(=num(MonthEnd(max(CalendarPeriod))))'},D_InvCal.CalendarMonth=,D_InvCal.CalendarYear=>}aaa)
The problem is if I select year 2017 the data in line chart is not organised in the right position.
Please check below.
- Mark as New
- Bookmark
- Subscribe
- Mute
- Subscribe to RSS Feed
- Permalink
- Report Inappropriate Content
Thank you all for your help. I managed to fix the problem. I changed the dimension to be monthyear and now all is ok.