Unlock a world of possibilities! Login now and discover the exclusive benefits awaiting you.
- Qlik Community
- :
- All Forums
- :
- QlikView App Dev
- :
- Re: Multiple Selection with Date Island to give re...
- Subscribe to RSS Feed
- Mark Topic as New
- Mark Topic as Read
- Float this Topic for Current User
- Bookmark
- Subscribe
- Mute
- Printer Friendly Page
- Mark as New
- Bookmark
- Subscribe
- Mute
- Subscribe to RSS Feed
- Permalink
- Report Inappropriate Content
Date Island to give results for each monthyear selected
Hi,
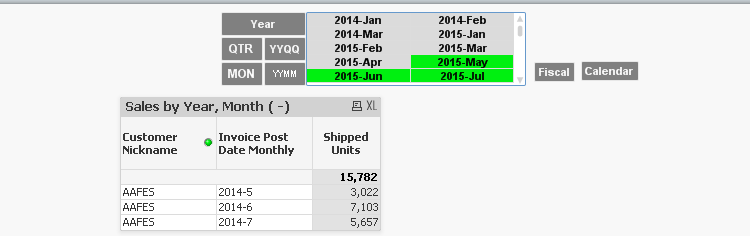
I've a Date Island for Fiscal and Calendar options which is used for selection of Fiscal Year Month, so when I select Jun-2016 the Shipped Units is 6069 and for July 2016 its 1421. When I select both together it does the aggregate of it and gives 7490 for each month which is not correct.
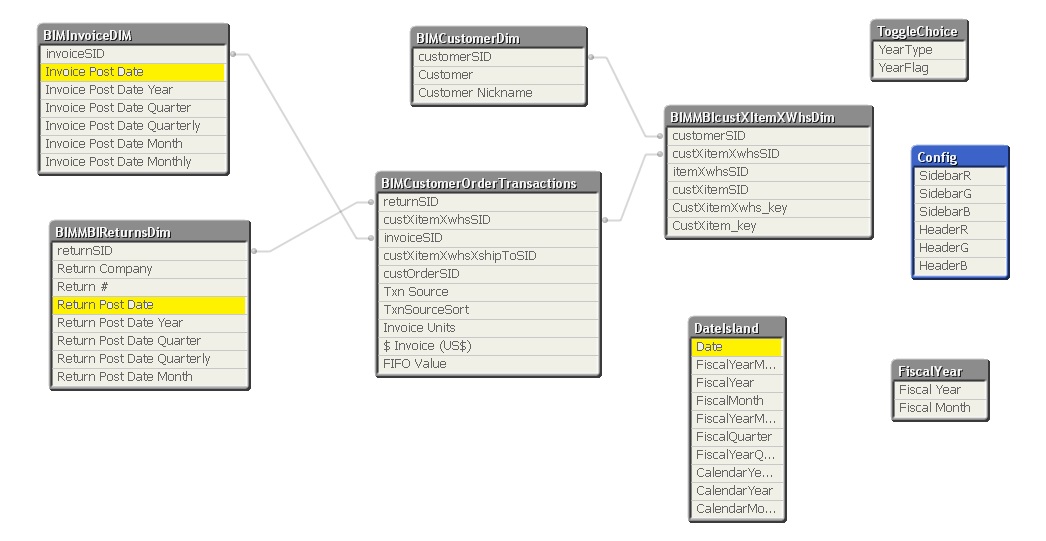
I need to get results for each individual months selected but instead getting aggregated results for both the months, and need help with set analysis expression to get the correct results. The Date Island is created b'c have multiple tables with different date fields.
Attached please find the Jun data, July data, and combined selection for Jun and July with Date Island Table box and the Invoice Date fields.
The expressions behind it is:
Sum({$<
[Invoice Post Date Monthly]=P({$} [YearMonthly]),
[Txn Source] = {'INV'}
>}
[Invoice Units])
When selecting the individual month its working fine, but not working when picked multiple selections and need help with it.
Need help with displaying the correct data for each months upon multiple (one or more ) selections of monthyear combination.
Any help would be greatly appreciated.
Thanks,
DD
- « Previous Replies
-
- 1
- 2
- Next Replies »
- Mark as New
- Bookmark
- Subscribe
- Mute
- Subscribe to RSS Feed
- Permalink
- Report Inappropriate Content
Hi,
did you try the aggregation of FiscalyearMonth?
if not, try the below
=Sum(Aggr({$< [Invoice Post Date Monthly]=P({$} [YearMonthly]), [Txn Source] = {'INV'} >}
[Invoice Units]),FiscalYearMonth)
- Mark as New
- Bookmark
- Subscribe
- Mute
- Subscribe to RSS Feed
- Permalink
- Report Inappropriate Content
Have tried aggr function doesn't work, maybe you might have a different alternative solution.
The FiscalYearMonth is a Data Island field and not working as maybe there's no way to detect what got selected by the expression maybe...not sure how would we able to solve this...need urgent help with solution if anybody can help...somehow its not able to distinguish the months selected.
Thanks,
DD
- Mark as New
- Bookmark
- Subscribe
- Mute
- Subscribe to RSS Feed
- Permalink
- Report Inappropriate Content
Can you post your sample qvw file? it would give the better understanding.
but try this instead of Fiscal month
=Sum(Aggr({$< [Invoice Post Date Monthly]=P({$} [YearMonthly]), [Txn Source] = {'INV'} >}
[Invoice Units]),[Invoice Post Date Month])
- Mark as New
- Bookmark
- Subscribe
- Mute
- Subscribe to RSS Feed
- Permalink
- Report Inappropriate Content
Hi,
I've attached the QV file just with the data that's needed and have took everything else out. Hope its helpful.
Also currently it has Invoice and Returns related dates, but there are way more dates and columns in my actual QV app.
Please help me solve the multiple calendar selection and would be very greatful.
Thanks,
DD
- Mark as New
- Bookmark
- Subscribe
- Mute
- Subscribe to RSS Feed
- Permalink
- Report Inappropriate Content
Hi Dipti,
I'm not sure for this. But, Could you please check your datamodel again?
You already mentioned you have created the data island for Calendar Periods and Fiscal Period. When we trying to add the field as dimension, we can't get the period wise data(here it is Fiscal Month and Calendar Month) as per my knowledge.
I need to get results for each individual months selected but instead getting aggregated results for both the months, and need help with set analysis expression to get the correct results. The Date Island is created b'c have multiple tables with different date fields.
Correct. because you are using [Invoice Post Date Monthly]=P({$} [YearMonthly]) - this expression gives whatever possible data contain in Invoice Post Date Monthly.
When we put the Island Table field in the Dimension, It will give entire value of Invoice Post Date Monthly.
Look into your data model,
Try to connect the DataIsland table with your fact table. (may be the date field).
And, I tried the table with Invoice Post Date Monthly as a dimension (removed the Fiscal and Calendar in Dimension)
and the expression
=Sum(aggr(Sum({$< [Invoice Post Date Monthly]=P({$} [YearMonthly]), [Txn Source] = {'INV'} >}
[Invoice Units]),[Invoice Post Date Monthly]))
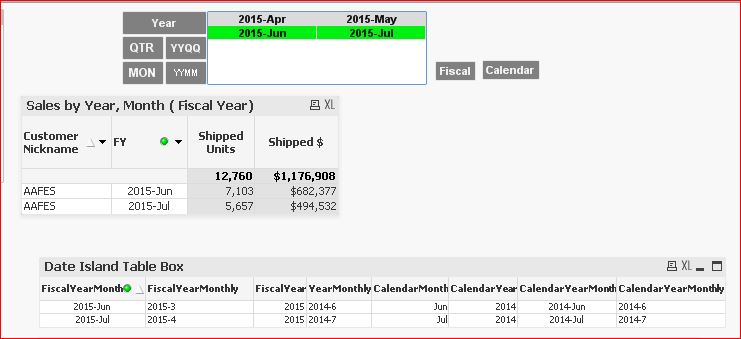
the data looks like the below.
Hope this will give the idea. May be some experts will give better picture for this.
- Mark as New
- Bookmark
- Subscribe
- Mute
- Subscribe to RSS Feed
- Permalink
- Report Inappropriate Content
Added from the above thread,
i just did a small change in data model (you know better about your data structure)
Now the model looks like
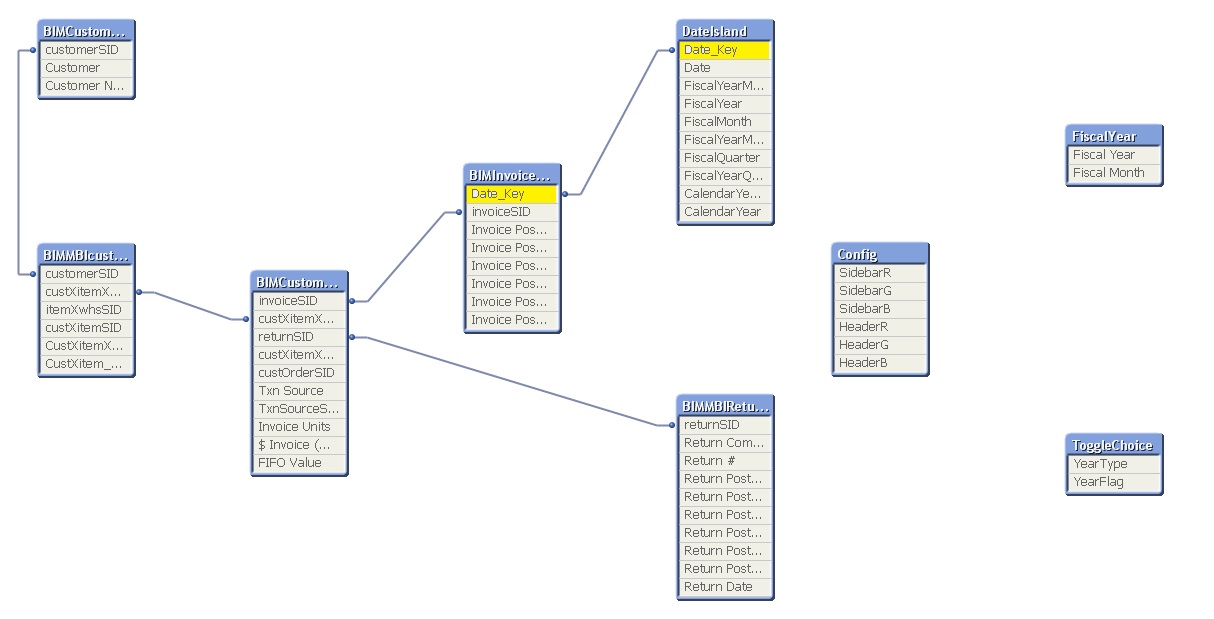
i don't touch any of your expression. Already it works well.
For attach purpose i reduced the data.
PFA qvw file for your reference.
Note: check the data model before you proceed anything.
- Mark as New
- Bookmark
- Subscribe
- Mute
- Subscribe to RSS Feed
- Permalink
- Report Inappropriate Content
Hi Settu,
Thanks for reply and workaround, that's exactly I started with but since I've multiple dates, like Return Dates, Ship Dates, Return Post Dates, Charge back, Cash Back, Mash, Order Begin, Order End...etc which is not in the QV file that I shared, how would I make to connect it with the DateIsland, that's reason why I didn't try to connect that table as if you see other expressions which are diabled...goes after multiple date field.
If you can show with the Return Post Date and Return Date as well that would be great too, your help with this is greatly appreciated.
Thanks again for your prompt reply and solution.
DD
- Mark as New
- Bookmark
- Subscribe
- Mute
- Subscribe to RSS Feed
- Permalink
- Report Inappropriate Content
Hi,
could you please into this thread and help to DiptiDesai for connect with Island calendar table with the different table date fields?
If you can show with the Return Post Date and Return Date as well that would be great too, your help with this is greatly appreciated.
As i'm beginner, not able to give the expected solution.
Thank you for your time.
- Mark as New
- Bookmark
- Subscribe
- Mute
- Subscribe to RSS Feed
- Permalink
- Report Inappropriate Content
Hi,
Can somebody please help me with the expression (Date Island ) to pick/show results for multiple months, even though the Date Island is not associated with the data model, and its on purpose b'c there are multiple date fields in the data model, using multiple date fields for different expressions and was hard to connect each of them with the same date field.
Any solution to this is greatly appreciated,
Thanks,
DD
- « Previous Replies
-
- 1
- 2
- Next Replies »