Unlock a world of possibilities! Login now and discover the exclusive benefits awaiting you.
- Qlik Community
- :
- All Forums
- :
- QlikView App Dev
- :
- Re: Difference between two dates
- Subscribe to RSS Feed
- Mark Topic as New
- Mark Topic as Read
- Float this Topic for Current User
- Bookmark
- Subscribe
- Mute
- Printer Friendly Page
- Mark as New
- Bookmark
- Subscribe
- Mute
- Subscribe to RSS Feed
- Permalink
- Report Inappropriate Content
Difference between two dates
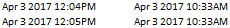
I WANT TO SHOW THE DIFFERENCE BETWEEN THE TWO DATES (The FIRST Col - The SECOND Col) and plot their values on a bar chart.
How can that be done ?
Thanks
- Tags:
- qlikview_scripting
- « Previous Replies
-
- 1
- 2
- Next Replies »
- Mark as New
- Bookmark
- Subscribe
- Mute
- Subscribe to RSS Feed
- Permalink
- Report Inappropriate Content
here you go !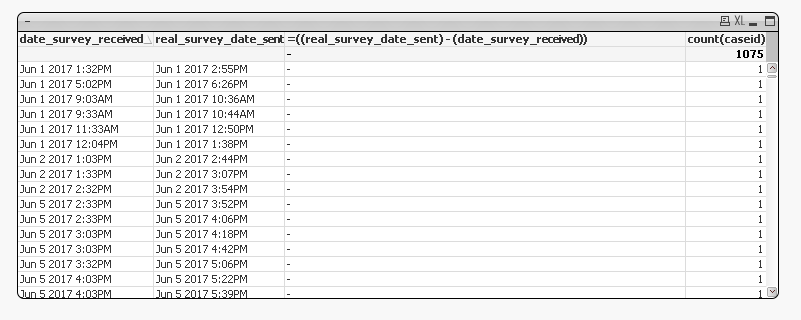
- Mark as New
- Bookmark
- Subscribe
- Mute
- Subscribe to RSS Feed
- Permalink
- Report Inappropriate Content
Try this?
Interval( (date(timestamp#(Field1,'MMM D YYYY hh:mmTT'),'DD/MM/YYYY')) - (date(timestamp#(Field2,'MMM D YYYY hh:mmTT'),'DD/MM/YYYY')), 'd')
- Mark as New
- Bookmark
- Subscribe
- Mute
- Subscribe to RSS Feed
- Permalink
- Report Inappropriate Content
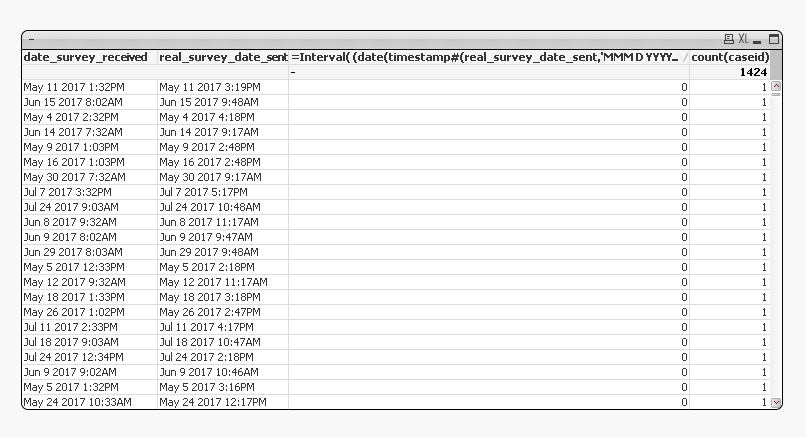
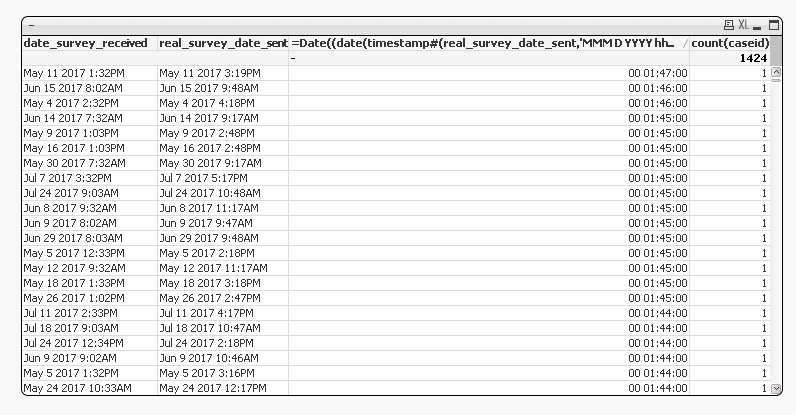
I'm getting the values in Integer.
After Formatting , I get this.
But the diff in days isn't seen here 😕
- Mark as New
- Bookmark
- Subscribe
- Mute
- Subscribe to RSS Feed
- Permalink
- Report Inappropriate Content
Try to change format only DD not DD:MM:YYYY
Another way
Date((date(timestamp#(Field1,'MMM D YYYY hh:mmTT'),'DD/MM/YYYY')) - (date(timestamp#(Field2,'MMM D YYYY hh:mmTT'),'DD/MM/YYYY')), 'DD')
- Mark as New
- Bookmark
- Subscribe
- Mute
- Subscribe to RSS Feed
- Permalink
- Report Inappropriate Content
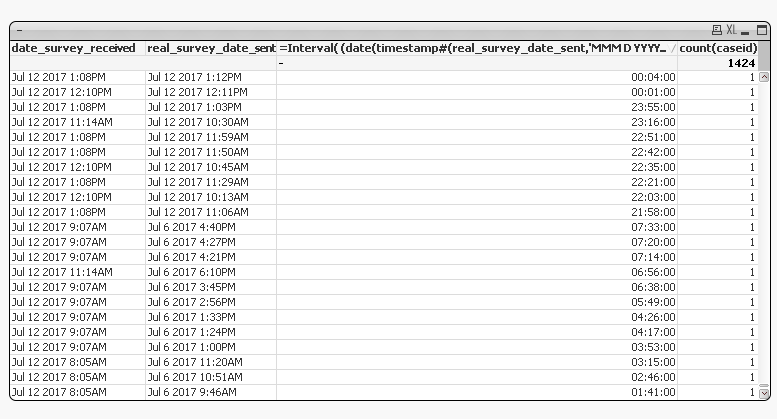
Got this using DD hh:mmTT ,Thanks Folks !
- Mark as New
- Bookmark
- Subscribe
- Mute
- Subscribe to RSS Feed
- Permalink
- Report Inappropriate Content
Great Qlik Community Tip: Marking Replies as Correct or Helpful
- « Previous Replies
-
- 1
- 2
- Next Replies »