Unlock a world of possibilities! Login now and discover the exclusive benefits awaiting you.
- Qlik Community
- :
- All Forums
- :
- QlikView App Dev
- :
- Re: Display sub-total for "other" dimension's attr...
Options
- Subscribe to RSS Feed
- Mark Topic as New
- Mark Topic as Read
- Float this Topic for Current User
- Bookmark
- Subscribe
- Mute
- Printer Friendly Page
Turn on suggestions
Auto-suggest helps you quickly narrow down your search results by suggesting possible matches as you type.
Showing results for
Partner - Creator
2015-06-15
06:18 AM
- Mark as New
- Bookmark
- Subscribe
- Mute
- Subscribe to RSS Feed
- Permalink
- Report Inappropriate Content
Display sub-total for "other" dimension's attribute of a table
Hi all,
I'm working on a table that illustrate products consumption.
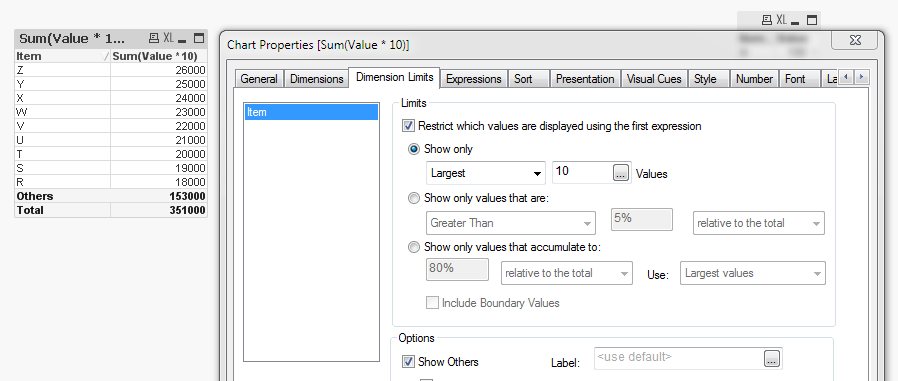
In particular, I want to show the cost for the top ten products consumed.
In the presentation tab, I've selected the options "Max number" =10 and "show other raws". (View the picture attached)
Someone know how to display the subtotal for the raw "Other" of the table?
Thanks!
Bye.
Davide
611 Views
5 Replies
Partner - Champion
2015-06-15
07:19 AM
- Mark as New
- Bookmark
- Subscribe
- Mute
- Subscribe to RSS Feed
- Permalink
- Report Inappropriate Content
Hi davide,
try using the Dimension limits option instead:
Andy
Partner - Creator
2015-06-15
07:41 AM
Author
- Mark as New
- Bookmark
- Subscribe
- Mute
- Subscribe to RSS Feed
- Permalink
- Report Inappropriate Content
Thanks Andy,
Sorry but I'didnt find the tab dimension limits.
What kind of chart are u using?
Bye
Davide
560 Views
Partner - Champion
2015-06-15
07:59 AM
- Mark as New
- Bookmark
- Subscribe
- Mute
- Subscribe to RSS Feed
- Permalink
- Report Inappropriate Content
Hi davide,
it's a straight table!
Andy
560 Views
Partner - Champion
2015-06-15
08:01 AM
- Mark as New
- Bookmark
- Subscribe
- Mute
- Subscribe to RSS Feed
- Permalink
- Report Inappropriate Content
What version of Qlikview are you using? This functionality was introduced with V11.
Andy
560 Views
Partner - Creator
2015-06-15
08:04 AM
Author
- Mark as New
- Bookmark
- Subscribe
- Mute
- Subscribe to RSS Feed
- Permalink
- Report Inappropriate Content
10.0
560 Views
Community Browser