Unlock a world of possibilities! Login now and discover the exclusive benefits awaiting you.
- Qlik Community
- :
- All Forums
- :
- QlikView App Dev
- :
- Dynamic Pie chart
- Subscribe to RSS Feed
- Mark Topic as New
- Mark Topic as Read
- Float this Topic for Current User
- Bookmark
- Subscribe
- Mute
- Printer Friendly Page
- Mark as New
- Bookmark
- Subscribe
- Mute
- Subscribe to RSS Feed
- Permalink
- Report Inappropriate Content
Dynamic Pie chart
Hi all,
I want to show a pie chart based on my filter pane selection (using qlik sense).
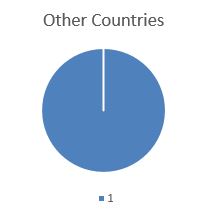
Initially my chart will be 100% with 1 colour, as i select country from the filter pane the pie chart should automatically adjust based on the country i have selected.
Default Selection :
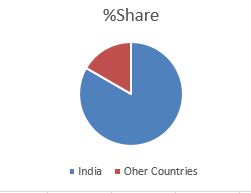
After selecting india from the filter pane the graph should look like this
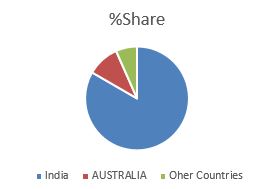
If i added another country then
Can anyone please help me to achieve the same, if I remove the same also the graph should update.
Thanks
Nicil
- Mark as New
- Bookmark
- Subscribe
- Mute
- Subscribe to RSS Feed
- Permalink
- Report Inappropriate Content
Please post sample QVW
- Mark as New
- Bookmark
- Subscribe
- Mute
- Subscribe to RSS Feed
- Permalink
- Report Inappropriate Content
Hi Anil,
Thanks for the reply,
I have found one method,
=IF (WildMatch(GetFieldSelections(Country, ',', 100), '*' & Country& '*'), GetFieldSelections(Country, ',', 100), 'Rest Of Country')
If i give like this then all the countries are appended to the pie chart like bangladesh, india, australia.....
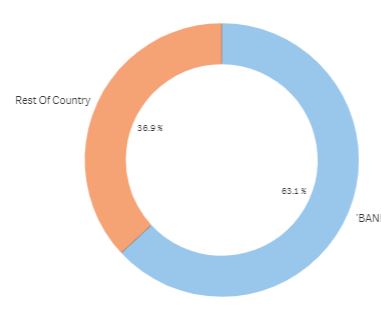
Is there any expressions we can use?
Thanks
Nicil
- Mark as New
- Bookmark
- Subscribe
- Mute
- Subscribe to RSS Feed
- Permalink
- Report Inappropriate Content
Can you share QVW file, We are fine even Scramble data
- Mark as New
- Bookmark
- Subscribe
- Mute
- Subscribe to RSS Feed
- Permalink
- Report Inappropriate Content
On what basis, the share percentage of 2nd and 3rd pic are same for single & even for multiple countries.
- Mark as New
- Bookmark
- Subscribe
- Mute
- Subscribe to RSS Feed
- Permalink
- Report Inappropriate Content
Please check the attached sample data
- Mark as New
- Bookmark
- Subscribe
- Mute
- Subscribe to RSS Feed
- Permalink
- Report Inappropriate Content
I have attached an excel with the selection, can you please check
- Mark as New
- Bookmark
- Subscribe
- Mute
- Subscribe to RSS Feed
- Permalink
- Report Inappropriate Content
Create Pie chart using below concept and check.
Dimension
=If(GetSelectedCount(Country)>1 and Match(Country,$(=Concat(Chr(39) & Country & Chr(39),','))),Country)
Expression
If(GetSelectedCount(Country)>1,Sum(Count),Sum(Count))
Or
If(GetSelectedCount(Country)>1,Sum({<Country={$(=Concat(Chr(39) & Country & Chr(39),','))}>} Count),Sum(Count))
- Mark as New
- Bookmark
- Subscribe
- Mute
- Subscribe to RSS Feed
- Permalink
- Report Inappropriate Content
Hi Anil,
Sorry for the late reply,
Its working but if we haven't selected any country, it shows as incomplete visualization.

Thanks
- Mark as New
- Bookmark
- Subscribe
- Mute
- Subscribe to RSS Feed
- Permalink
- Report Inappropriate Content
Please check attachment and use dimension as below
=If(GetSelectedCount(Country)>1 and Match(Country,$(=Concat(Chr(39) & Country & Chr(39),','))),Country,Country)