Unlock a world of possibilities! Login now and discover the exclusive benefits awaiting you.
- Qlik Community
- :
- All Forums
- :
- QlikView App Dev
- :
- Re: Forcing all labels to be visable after selecti...
- Subscribe to RSS Feed
- Mark Topic as New
- Mark Topic as Read
- Float this Topic for Current User
- Bookmark
- Subscribe
- Mute
- Printer Friendly Page
- Mark as New
- Bookmark
- Subscribe
- Mute
- Subscribe to RSS Feed
- Permalink
- Report Inappropriate Content
Forcing all labels to be visable after selection
Another challenge for you all!
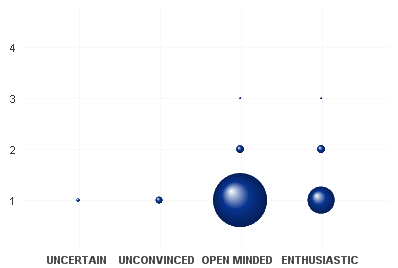
I am using a bubble chart to show results of mobility and change levels.
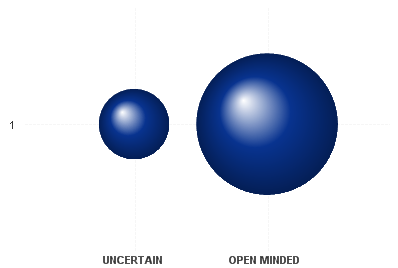
When I have all data selected all of the labels are there, however when I filter to a lower level labels are lost.
How can I force the label to always stay?
Not filtered

Filtered

Thanks
Rob
- « Previous Replies
-
- 1
- 2
- Next Replies »
Accepted Solutions
- Mark as New
- Bookmark
- Subscribe
- Mute
- Subscribe to RSS Feed
- Permalink
- Report Inappropriate Content
Maybe I misunderstood your requirement, but what's wrong with the solution Henric suggested?
How do you want the chart to react on user selections?
- Mark as New
- Bookmark
- Subscribe
- Mute
- Subscribe to RSS Feed
- Permalink
- Report Inappropriate Content
Exactly this problem - but for a pivot table - is solved in this blog post: http://community.qlik.com/blogs/qlikviewdesignblog/2012/11/02/tips-and-tricks-pixel-perfect-or-qlikv....
The basic idea is to use set analysis to always show the numbers (the bubbles) but use an expression that makes the clor gray if the number (the bubble) is excluded through selection.
HIC
- Mark as New
- Bookmark
- Subscribe
- Mute
- Subscribe to RSS Feed
- Permalink
- Report Inappropriate Content
Henric, thanks for the suggestion but it didn't help.
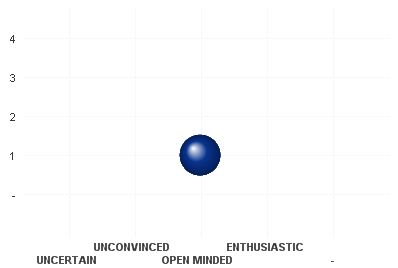
I have taken off "Suppress Zero-Values" and this now keeps all labels visable when I filter. See image below.
However, I now have the issue of the -(Hyphen) appearing on the chart.
I had this issue before and used the following in an expression -={'-'} to remove the problem
I've tried this in the current expression but not sure if I'm doing this right. Any ideas?
=Sum(change_profile_count)
Chart after Suppressing Zero-Values

- Mark as New
- Bookmark
- Subscribe
- Mute
- Subscribe to RSS Feed
- Permalink
- Report Inappropriate Content
The hyphen represents NULL values in the dimension, so if you check "Suppress when value is Null" on ChartProperties->Dimensions, it should disappear.
HIC
- Mark as New
- Bookmark
- Subscribe
- Mute
- Subscribe to RSS Feed
- Permalink
- Report Inappropriate Content
That takes me back to the Filtered chart above where you loose the labels!
Seems you can have one or the other.
- Mark as New
- Bookmark
- Subscribe
- Mute
- Subscribe to RSS Feed
- Permalink
- Report Inappropriate Content
On ChartProperties->Presentation, you have "Suppress Zero values" and "Suppress Missing". Make sure these are unchecked.
HIC
- Mark as New
- Bookmark
- Subscribe
- Mute
- Subscribe to RSS Feed
- Permalink
- Report Inappropriate Content
Yes they are both unchecked.
As I say this take me back to the issue with the labels disapearing.
Rob
- Mark as New
- Bookmark
- Subscribe
- Mute
- Subscribe to RSS Feed
- Permalink
- Report Inappropriate Content
I have recreated what you describe, and I see what you mean.
Would it be an acceptable work-around to show all bubbles, but show the non-selected ones gray? See attachment. Then you would get the labels exactly the way you want them.
HIC
- Mark as New
- Bookmark
- Subscribe
- Mute
- Subscribe to RSS Feed
- Permalink
- Report Inappropriate Content
And if you want to hide the bubbles, just use
if(Count(Profile)=0,argb(0,255,255,255))
- Mark as New
- Bookmark
- Subscribe
- Mute
- Subscribe to RSS Feed
- Permalink
- Report Inappropriate Content
Hi both, that was a nice idea but i'm not sure that's going to be acceptable.
I think I might have to go back to the data and see how we can pull it in without the -(Hyphen) info
But thanks for looking at this.
There has to be an answer!
- « Previous Replies
-
- 1
- 2
- Next Replies »