Unlock a world of possibilities! Login now and discover the exclusive benefits awaiting you.
- Qlik Community
- :
- All Forums
- :
- QlikView App Dev
- :
- Format pivot table
- Subscribe to RSS Feed
- Mark Topic as New
- Mark Topic as Read
- Float this Topic for Current User
- Bookmark
- Subscribe
- Mute
- Printer Friendly Page
- Mark as New
- Bookmark
- Subscribe
- Mute
- Subscribe to RSS Feed
- Permalink
- Report Inappropriate Content
Format pivot table
Hi!
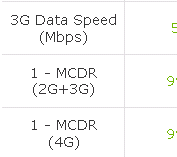
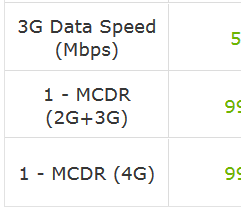
In my Pivot table the expresion "header" differ in the client compared to what is see i AccessPoint (see last row).
I want to force the text to "wrap" .
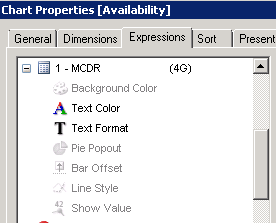
I have used the Chart Properties 'Text Format' to get bold text by using '<B>'.
Is there a similar way to also force the text to wrap?
Qlik View client:

AccessPoint:


- Mark as New
- Bookmark
- Subscribe
- Mute
- Subscribe to RSS Feed
- Permalink
- Report Inappropriate Content
I think the reason is that the desktop client and the access point use different fonts (type, size) and also different border/margin-settings and therefore they are not identically and one text may fit within one row and the other is too large and will create a line-break.
You could try to change the font type and or size and maybe you find a combination which worked in yor case. If not you will need to enforce the line-break with some logic, like:
mid(Dim, 1, 10) & chr(10) & mid(Dim, 11)
or maybe
replace(Dim, '(', chr(10) & '(')
There are a lot of ways with string-functions to check the string-value and to adjust it if it's needed.
- Marcus
- Mark as New
- Bookmark
- Subscribe
- Mute
- Subscribe to RSS Feed
- Permalink
- Report Inappropriate Content
Hi!
A small mistake in my question.
The 'bold' setting works on the valus in the table. If a limit is crossed the text colour change to red and Bold.
If i want to try you suggestions, where should they be added?
- Mark as New
- Bookmark
- Subscribe
- Mute
- Subscribe to RSS Feed
- Permalink
- Report Inappropriate Content
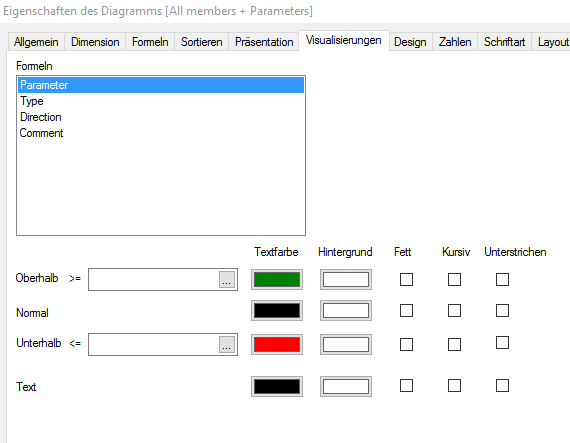
If the conditions rather simple you could try it with the settings from tab visualization and if not with attribut-expressions: How to Create Chart Attribute Expressions
- Marcus
- Mark as New
- Bookmark
- Subscribe
- Mute
- Subscribe to RSS Feed
- Permalink
- Report Inappropriate Content
Hi!
According to the document you can just change text to e.g. Bold and Italic. Not Wrap.
What do you man with 'settings from tab visualization'?
- Mark as New
- Bookmark
- Subscribe
- Mute
- Subscribe to RSS Feed
- Permalink
- Report Inappropriate Content
No, a wrapping of cells, adjusting the heights of rows and similar things aren't possible - this are all global options and could not react on any conditions.
With tab visualization was the following meant:

- Marcus