Unlock a world of possibilities! Login now and discover the exclusive benefits awaiting you.
Announcements
July 15, NEW Customer Portal: Initial launch will improve how you submit Support Cases.
IMPORTANT DETAILS
- Qlik Community
- :
- All Forums
- :
- QlikView App Dev
- :
- Re: Gauge Chart- how to create reverse gauge chart
Options
- Subscribe to RSS Feed
- Mark Topic as New
- Mark Topic as Read
- Float this Topic for Current User
- Bookmark
- Subscribe
- Mute
- Printer Friendly Page
Turn on suggestions
Auto-suggest helps you quickly narrow down your search results by suggesting possible matches as you type.
Showing results for
Anonymous
Not applicable
2016-12-27
06:34 AM
- Mark as New
- Bookmark
- Subscribe
- Mute
- Subscribe to RSS Feed
- Permalink
- Report Inappropriate Content
Gauge Chart- how to create reverse gauge chart
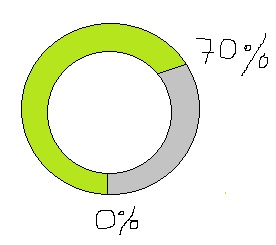
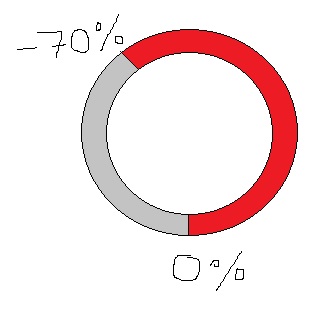
The first image is showing +ve profit in green so it can be easily done in gauge chart. But the second one is showing -ve profit in red and pointing in reverse direction, which i am unable to do it. we knw what profit means(selling price-cost price).
How to achieve the second gauge chart?
720 Views
1 Reply
Master
2016-12-27
07:21 AM
- Mark as New
- Bookmark
- Subscribe
- Mute
- Subscribe to RSS Feed
- Permalink
- Report Inappropriate Content
if we multiply the value with - we will get that right?
like
= -*sum(profit-cost)
correct me if i mistake my assumption
552 Views