Unlock a world of possibilities! Login now and discover the exclusive benefits awaiting you.
- Qlik Community
- :
- All Forums
- :
- QlikView App Dev
- :
- Generate a line Chart
- Subscribe to RSS Feed
- Mark Topic as New
- Mark Topic as Read
- Float this Topic for Current User
- Bookmark
- Subscribe
- Mute
- Printer Friendly Page
- Mark as New
- Bookmark
- Subscribe
- Mute
- Subscribe to RSS Feed
- Permalink
- Report Inappropriate Content
Generate a line Chart
Hello Together,
unfortunately, I could find nothing in the forum and need some help.
Given:
The field [date] has, for example, 4 records. To every [date] there is n [values].
To every [date] there is in the field n [values].
For example:
5/5/2010-> 10; 10 ; 13 sum= 33
5/6/2010-> 8; 9 sum= 17
5/7/2010-> 12 sum= 12
5/8/2010-> 5; 8; 10 sum= 23
the goal:
I want a line chart. The X-axis should indicate the available [date], e.g., 5/5/2010, 5/6/2010 5/7/2010 ...
For the date 5/5/2010 the sum 33 = 33 should be associated. y = 33
For the date 5/6/2010 the sum 33 + 17 = 50 should be associated. y = 50
For the date 5/7/2010 the sum 33+17+12 = 62 should be associated. y = 62
For the date 5/8/2010 the sum 33+17+12+ 23 = 85 should be associated. y = 85
How I do make this? How must the formula look in the chart? Thank you very much !
- Tags:
- full_accumulation
- « Previous Replies
- Next Replies »
- Mark as New
- Bookmark
- Subscribe
- Mute
- Subscribe to RSS Feed
- Permalink
- Report Inappropriate Content
Hi, did you try "Full Accumulation" in the "Expression" tab?, this could work fine for what you want.
rgds
- Mark as New
- Bookmark
- Subscribe
- Mute
- Subscribe to RSS Feed
- Permalink
- Report Inappropriate Content
Hi Hector M. ,
did not work ! Another idea ? maybe in the formula ?
- Mark as New
- Bookmark
- Subscribe
- Mute
- Subscribe to RSS Feed
- Permalink
- Report Inappropriate Content
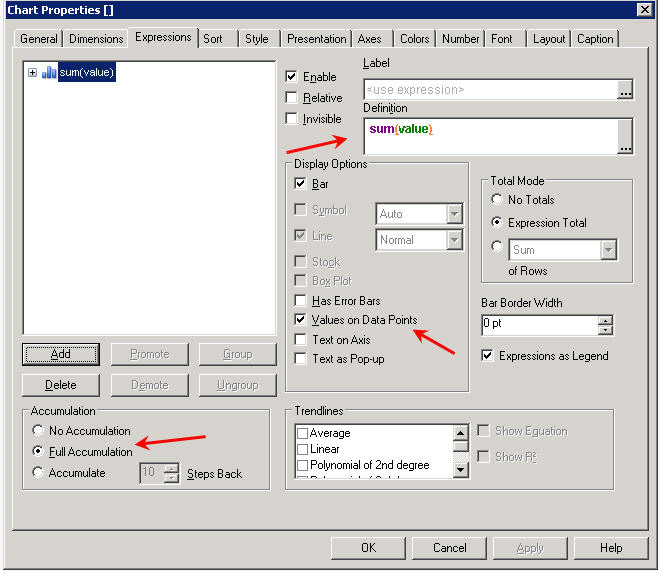
Accumulation | In this group, you decide if and to what extent you wish your graph to display accumulated values. One of three settings is selected. No Accumulation disables accumulation of y-values. With Full Accumulation selected, all y-values are successively accumulated. The Accumulate ... Steps Back allows you to decide how many previous values you want to include in the accumulation. Chart Properties: Expressions page you can see the above accumulation option and I am thinkking this option might help you. |
- Mark as New
- Bookmark
- Subscribe
- Mute
- Subscribe to RSS Feed
- Permalink
- Report Inappropriate Content
so, a line chart with dimension "Date" and expression "Sum(Field)" + Full Accumulation
or upload an example 
rgds
- Mark as New
- Bookmark
- Subscribe
- Mute
- Subscribe to RSS Feed
- Permalink
- Report Inappropriate Content
Here is the example, I hope that helps.
- Mark as New
- Bookmark
- Subscribe
- Mute
- Subscribe to RSS Feed
- Permalink
- Report Inappropriate Content
Here is the place were you set it.
- Mark as New
- Bookmark
- Subscribe
- Mute
- Subscribe to RSS Feed
- Permalink
- Report Inappropriate Content
Hello together and many thanks to you to help me.
I believe I had wrong expressed myself.
Here my formula.
=Sum ([values]) * 5.8 / ((Max (num ([datum])) - num ([6/6/2010])) * 50000 / 34)
This formula calculates to me a factor. It works well.
Explanation of the fields:
[values]-> can have many values
Max (num ([datum]))-> This are my data fields. Here only the most actual data recordset is selected.
If you can start with that ?
- Mark as New
- Bookmark
- Subscribe
- Mute
- Subscribe to RSS Feed
- Permalink
- Report Inappropriate Content
Please provide some data and example like every one attaches small qvws so that it is more clear to understand.
- Mark as New
- Bookmark
- Subscribe
- Mute
- Subscribe to RSS Feed
- Permalink
- Report Inappropriate Content
i make a qvw file for you. How can i upload it here ?
- « Previous Replies
- Next Replies »