Unlock a world of possibilities! Login now and discover the exclusive benefits awaiting you.
- Qlik Community
- :
- All Forums
- :
- QlikView App Dev
- :
- Histogram for frequency of deals + cumulative line...
- Subscribe to RSS Feed
- Mark Topic as New
- Mark Topic as Read
- Float this Topic for Current User
- Bookmark
- Subscribe
- Mute
- Printer Friendly Page
- Mark as New
- Bookmark
- Subscribe
- Mute
- Subscribe to RSS Feed
- Permalink
- Report Inappropriate Content
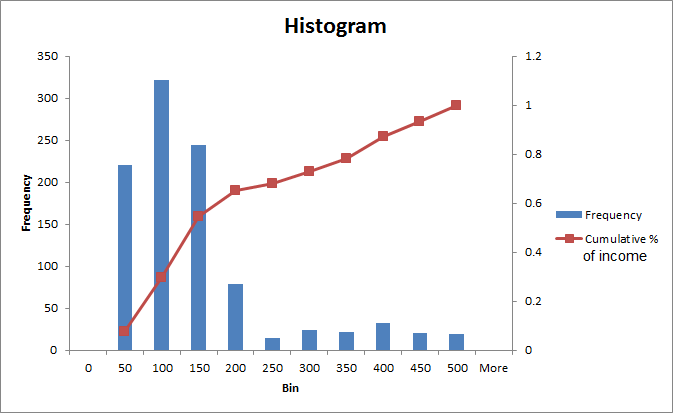
Histogram for frequency of deals + cumulative line for income generated from these deals
Hi all,
I have a list of deals we have. Some are small, some are medium and some are big. I want to test a hunch that the small deals take an unproportionate amount of work. Without getting to the details as to why I need it in the following format, I'd like to get your help to create the following object:
horizontal axis = bins for deal size, multiples of $50.
left vertical axis = absolute numbers, to represent the number of deals that fall under each of these bins (just a regular histogram...).
right vertical axis = %. These will represent the cumulative % of total income generated from those deals. That is, unlike regular histograms with an accumulation line, here the line represents the cumulative % of income generated from the deals. So we're moving from looking at the frequency, to looking at the portion of the $ they generate. Hope I'm making myself clear enough. For example: if all the deals together generated 10,000 MRR (monthly recurring revenue), and there are 40 deals in the first bin of $0-50, and the total MRR from those 40 deals is $1600, than the right vertical axis value would be 16%. If the next bin generates $400, than the value would be 20% (since it cumulative, etc.).
Since the data I work with is confidential, I attach a file with dummy data and the end result I had in mind.
would really really appreciate your help! thanks! 
- « Previous Replies
-
- 1
- 2
- Next Replies »
- Mark as New
- Bookmark
- Subscribe
- Mute
- Subscribe to RSS Feed
- Permalink
- Report Inappropriate Content
that would explain it and also explain why the cumulative % MRR is > 1, and cumulative % deals <1.
Thanks again
- « Previous Replies
-
- 1
- 2
- Next Replies »