Unlock a world of possibilities! Login now and discover the exclusive benefits awaiting you.
- Qlik Community
- :
- All Forums
- :
- QlikView App Dev
- :
- Re: Holding a summed value through a drilldown
- Subscribe to RSS Feed
- Mark Topic as New
- Mark Topic as Read
- Float this Topic for Current User
- Bookmark
- Subscribe
- Mute
- Printer Friendly Page
- Mark as New
- Bookmark
- Subscribe
- Mute
- Subscribe to RSS Feed
- Permalink
- Report Inappropriate Content
Holding a summed value through a drilldown
I have a situation where i am selecting a colour based on thresholds at the top level of a UK postcode hierarchy. The drilldown group looks like this:
Area -> District -> Sector -> Postcode
e.g. AB -> AB53 -> AB53 5 -> AB53 5ST
I want to hold the colour calculated at Area level, and always use that, no matter where i am in the drilldown. So let's say i'm at the bottom of the hierarchy and have the following results for the above postcode
| Drilldown Level | Value of Sum (Issued) at Drilldown level |
|---|---|
| Area | 10000 |
| District | 2000 |
| Sector | 500 |
| Postcode | 30 |
I always want to use 10000 (the result at Area level), no matter the level of the drilldown, as the basis to calulate the (same!) colour against some variableised thresholds. I have tried various combinations of the TOTAL operator in the sum, and also tinkered with Aggr(), but without much success.
The only way that i have managed to get this properly working is using $x in set analysis to go back x selections, but that's not going to work if the user does anything other than perform a straight drilldown on the chart without making any other selections in the application.
Can anyone suggest the best way to do this as i must be missing something...
Accepted Solutions
- Mark as New
- Bookmark
- Subscribe
- Mute
- Subscribe to RSS Feed
- Permalink
- Report Inappropriate Content
- Mark as New
- Bookmark
- Subscribe
- Mute
- Subscribe to RSS Feed
- Permalink
- Report Inappropriate Content
something like the attached?
- Mark as New
- Bookmark
- Subscribe
- Mute
- Subscribe to RSS Feed
- Permalink
- Report Inappropriate Content
See attached example.
talk is cheap, supply exceeds demand
- Mark as New
- Bookmark
- Subscribe
- Mute
- Subscribe to RSS Feed
- Permalink
- Report Inappropriate Content
Hi Ioannis,
That's fine if they are just set up as separate dimensions, but i need a hierarchical drilldown group, at which point your example does not work.
- Mark as New
- Bookmark
- Subscribe
- Mute
- Subscribe to RSS Feed
- Permalink
- Report Inappropriate Content
True if the group is a Drill Down. It only works with Cyclic Group.
So you need to add the code proposed by Gysbert to make it work.
Thank you.
Ioannis.
- Mark as New
- Bookmark
- Subscribe
- Mute
- Subscribe to RSS Feed
- Permalink
- Report Inappropriate Content
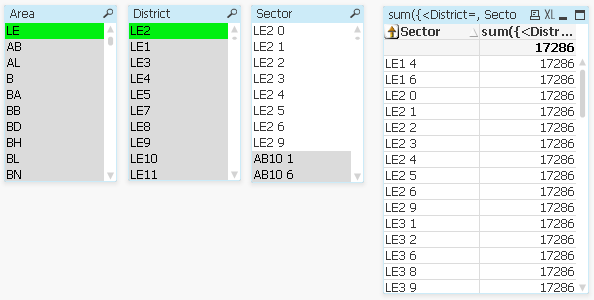
Thanks Gysbert, but i still have an issue. When i apply your syntax, i do get the right total, but i also get lots of extra sectors listed that, as you can see, are outwith the possible values in my Sector field. In the chart, i need to see only the sectors that are possible values in the sector field. I can see why this is happening - by setting the fields to blank in the set analysis, it's bringing other field values into play.
I have managed to get this far and this is what is causing me the real issue. I need to get rid of the extra sectors.
- Mark as New
- Bookmark
- Subscribe
- Mute
- Subscribe to RSS Feed
- Permalink
- Report Inappropriate Content
Add the p (possible values) function :
sum({<District=, Sector=,Postcode={$(=p(Postcode))}>} TOTAL <Area> Value)
Also in District and Sector if needed. See attached.
- Mark as New
- Bookmark
- Subscribe
- Mute
- Subscribe to RSS Feed
- Permalink
- Report Inappropriate Content
See attached qvw.
talk is cheap, supply exceeds demand
- Mark as New
- Bookmark
- Subscribe
- Mute
- Subscribe to RSS Feed
- Permalink
- Report Inappropriate Content
Gysbert, thank you so much. I applied your logic to Ioannis' file and then my application, and it worked! Amazing, thank you so much 