Unlock a world of possibilities! Login now and discover the exclusive benefits awaiting you.
- Qlik Community
- :
- All Forums
- :
- QlikView App Dev
- :
- Re: How can I use data but not display it.
- Subscribe to RSS Feed
- Mark Topic as New
- Mark Topic as Read
- Float this Topic for Current User
- Bookmark
- Subscribe
- Mute
- Printer Friendly Page
- Mark as New
- Bookmark
- Subscribe
- Mute
- Subscribe to RSS Feed
- Permalink
- Report Inappropriate Content
How can I use data but not display it.
I have a set of data (below) in which I need to use the full set of data but I do now want to display all of it.
In the below data I need to use class 1, class 2 & waste to calculate the percentage produced, however I only want to display class 2 & waste in tables and charts (i.e.; use class 1 but hide it from view)
How would I go about this? Dimension limits only seem to refer to numerical based selections (top 10 etc.)
- « Previous Replies
-
- 1
- 2
- Next Replies »
Accepted Solutions
- Mark as New
- Bookmark
- Subscribe
- Mute
- Subscribe to RSS Feed
- Permalink
- Report Inappropriate Content
I am not sure what you are seeing, but I am seeing the same results based on Stefan's expression (with addition of the inner set analysis)
=Sum(TOTAL<Product> Aggr(Sum({<Prod_Class>}FPInnerCount),ProductionRun,Product,Prod_Class))
vs. yours
Sum(ALL<Product>Aggr(Sum({<Prod_Class>}FPInnerCount),ProductionRun,Product,Prod_Class))
Tried clearing out some selections and did not find any differences in the number. What selections are making the two expressions deviate for you?
- Mark as New
- Bookmark
- Subscribe
- Mute
- Subscribe to RSS Feed
- Permalink
- Report Inappropriate Content
Not entirely sure what you are trying to do, do you have a sample you can share?
- Mark as New
- Bookmark
- Subscribe
- Mute
- Subscribe to RSS Feed
- Permalink
- Report Inappropriate Content
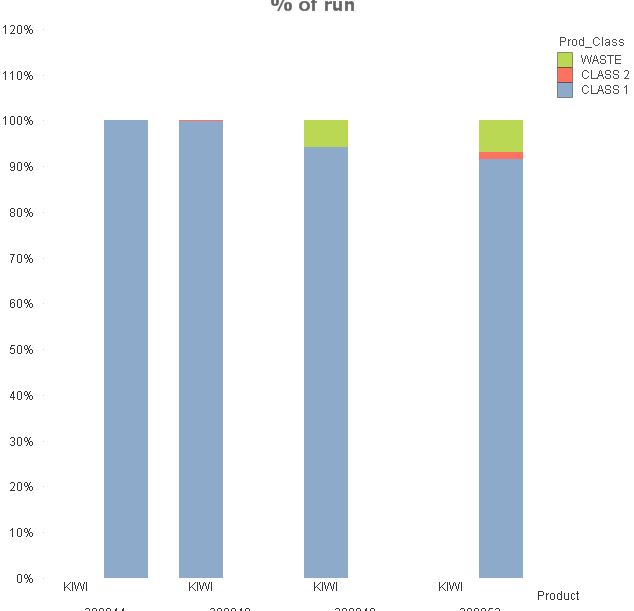
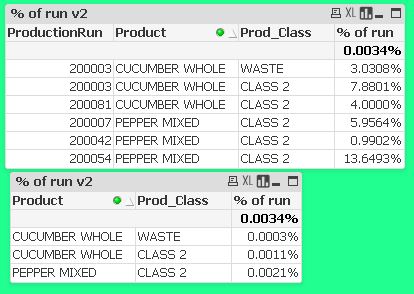
Basically what I after is the below chart but not showing class 1. The class 1 is used in the calculation for the percentage so needs to be considered but I don't want to show it on the charts. (overwhelms the key data of class 2 and waste).
- Mark as New
- Bookmark
- Subscribe
- Mute
- Subscribe to RSS Feed
- Permalink
- Report Inappropriate Content
Hi!
Can you post your data file?
- Mark as New
- Bookmark
- Subscribe
- Mute
- Subscribe to RSS Feed
- Permalink
- Report Inappropriate Content
Data file attached.
- Mark as New
- Bookmark
- Subscribe
- Mute
- Subscribe to RSS Feed
- Permalink
- Report Inappropriate Content
May be this?
=sum({<Prod_Class -= {'CLASS 1'}>}RMInnerCount)/sum( {1} TOTAL <ProductionRun> RMInnerCount)
- Mark as New
- Bookmark
- Subscribe
- Mute
- Subscribe to RSS Feed
- Permalink
- Report Inappropriate Content
That works well if I have the ProductionRun present in the table.
If I create an alternative table which does not include the ProductionRun (i.e.; dimension is purely Category / Product) then I am getting incorrect results.
Might I be better doing the calculation in the script and creating a variable?
- Mark as New
- Bookmark
- Subscribe
- Mute
- Subscribe to RSS Feed
- Permalink
- Report Inappropriate Content
If you remove ProductionRun, you loose the ability to look the uniqueness provided by ProductionRun and Category by itself will start grouping up. So essentially if you just have Category, you will only see one of PEPPER, TOPFRUIT, STONEFRUIT...and so on...
Would you then would like to average or Sum or Min or Max the values among differen ProductionRun for a single Category and Prod_Class?
- Mark as New
- Bookmark
- Subscribe
- Mute
- Subscribe to RSS Feed
- Permalink
- Report Inappropriate Content
What you want to do (use dimensional data without displaying it in the table) can be achieved using advanced aggregation:
- Mark as New
- Bookmark
- Subscribe
- Mute
- Subscribe to RSS Feed
- Permalink
- Report Inappropriate Content
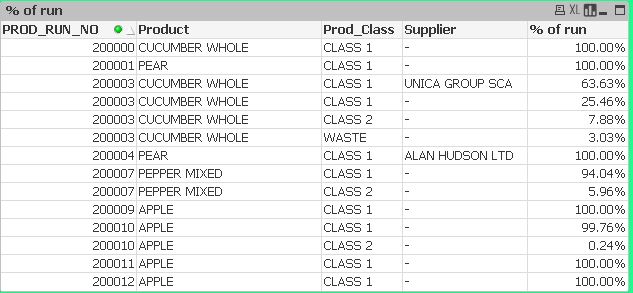
I'd like the sum of the percenatges of product generated per run.
For example (from Excel)
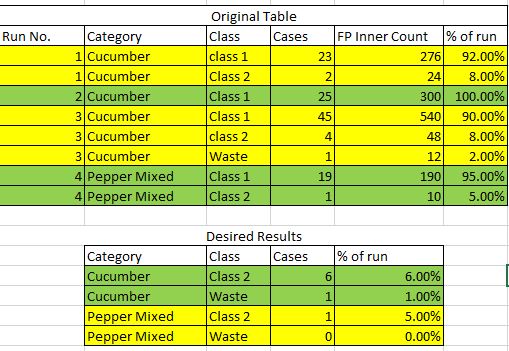
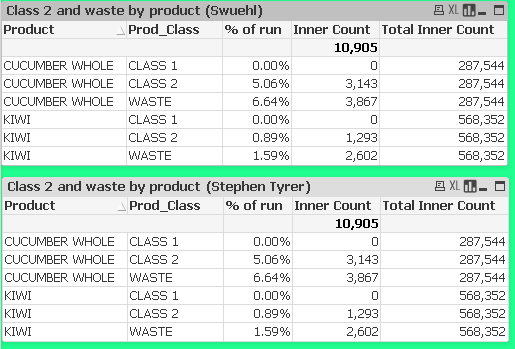
What I am getting is (percentages in top table correct, percentages in lower table long way form correct - cucumber class 2 should be 3.24%):
- « Previous Replies
-
- 1
- 2
- Next Replies »