Unlock a world of possibilities! Login now and discover the exclusive benefits awaiting you.
- Qlik Community
- :
- All Forums
- :
- QlikView App Dev
- :
- Re: How to Get Total TRX per Group per Month
- Subscribe to RSS Feed
- Mark Topic as New
- Mark Topic as Read
- Float this Topic for Current User
- Bookmark
- Subscribe
- Mute
- Printer Friendly Page
- Mark as New
- Bookmark
- Subscribe
- Mute
- Subscribe to RSS Feed
- Permalink
- Report Inappropriate Content
How to Get Total TRX per Group per Month
Hi,
Anyone can help me how to get the Percentage of Trx per Group per Month.
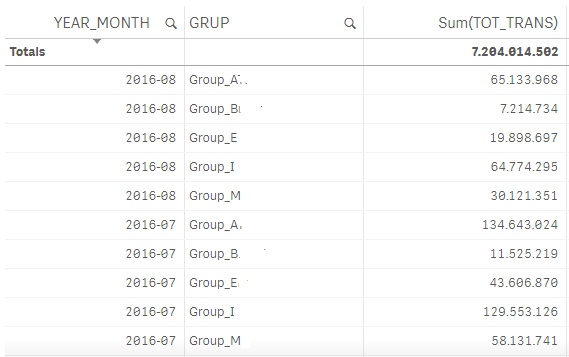
I have the data like this :

Sample : on 2016-07, I want to get the percentage of transaction of Group A, which is :
134.643.024 / (134.643.024 + 11.525.219 + 43.606.870 + 129.553.126 + 58.131.741)
Thanks
- Tags:
- qlikview_scripting
- « Previous Replies
-
- 1
- 2
- Next Replies »
Accepted Solutions
- Mark as New
- Bookmark
- Subscribe
- Mute
- Subscribe to RSS Feed
- Permalink
- Report Inappropriate Content
- Mark as New
- Bookmark
- Subscribe
- Mute
- Subscribe to RSS Feed
- Permalink
- Report Inappropriate Content
try this
sum(aggr(tot_trans,grup,yaer_month))
/
sum(total aggr(tot_trans,grup,yaer_month))
- Mark as New
- Bookmark
- Subscribe
- Mute
- Subscribe to RSS Feed
- Permalink
- Report Inappropriate Content
May be this:
Sum(TOT_TRANS)/Sum(TOTAL <YEAR_MONTH> TOT_TRANS)
- Mark as New
- Bookmark
- Subscribe
- Mute
- Subscribe to RSS Feed
- Permalink
- Report Inappropriate Content
HI,
the query it's not working.
Thanks
- Mark as New
- Bookmark
- Subscribe
- Mute
- Subscribe to RSS Feed
- Permalink
- Report Inappropriate Content
Hi Sunny,
It's Work.
Could you tell me please, How If I want to show the data on a line Chart?
I want the line Chart is Fixed and I want to show 12 months data.
My set Analysis is like this, and the Chart still change when I select a Year_Month :
sum(
{<YEAR_MONTH = {">=$(=date(addmonths(max({1}YEAR_MONTH), -12), 'YYYY-MM'))"} * {"<=$(=max({1}YEAR_MONTH))"}>}
TOT_TRANS)
/
Sum(TOTAL <YEAR_MONTH> TOT_TRANS)
Thanks a lot
- Mark as New
- Bookmark
- Subscribe
- Mute
- Subscribe to RSS Feed
- Permalink
- Report Inappropriate Content
Hi,
Sum(TOT_TRANS) / SUM( TOTAL <grup,year_month> TOT_TRANS)
Regards!!
- Mark as New
- Bookmark
- Subscribe
- Mute
- Subscribe to RSS Feed
- Permalink
- Report Inappropriate Content
Did you try what I proposed?
- Mark as New
- Bookmark
- Subscribe
- Mute
- Subscribe to RSS Feed
- Permalink
- Report Inappropriate Content
May be you need to ignore YEAR_MONTH is the denominator as well:
Sum({<YEAR_MONTH = {">=$(=date(addmonths(max({1}YEAR_MONTH), -12), 'YYYY-MM'))"} * {"<=$(=max({1}YEAR_MONTH))"}>} TOT_TRANS)
/
Sum(TOTAL <YEAR_MONTH> {<YEAR_MONTH >} TOT_TRANS)
- Mark as New
- Bookmark
- Subscribe
- Mute
- Subscribe to RSS Feed
- Permalink
- Report Inappropriate Content
Hi Sunny,
The line Chart still change when I select the Year_Month.
If I select 2016-06, I want to have a line chart from 2015-06 - 2016-06
Before Selection

After select a Year_month:
Thanks For Your Help
- Mark as New
- Bookmark
- Subscribe
- Mute
- Subscribe to RSS Feed
- Permalink
- Report Inappropriate Content
How about this:
Sum({1<YEAR_MONTH = {">=$(=Date(AddMonths(Max({1}YEAR_MONTH), -12), 'YYYY-MM'))<=$(=Max({1}YEAR_MONTH))"}>} TOT_TRANS)
/
Sum(TOTAL <YEAR_MONTH> {1} TOT_TRANS)
If it still doesn't work, would you be able to share a sample?
- « Previous Replies
-
- 1
- 2
- Next Replies »