Unlock a world of possibilities! Login now and discover the exclusive benefits awaiting you.
- Qlik Community
- :
- All Forums
- :
- QlikView App Dev
- :
- Re: How to chart 2 independent measures on a commo...
- Subscribe to RSS Feed
- Mark Topic as New
- Mark Topic as Read
- Float this Topic for Current User
- Bookmark
- Subscribe
- Mute
- Printer Friendly Page
- Mark as New
- Bookmark
- Subscribe
- Mute
- Subscribe to RSS Feed
- Permalink
- Report Inappropriate Content
How to chart 2 independent measures on a common dimension?
I have a problem charting 2 measures on a common dimension. I have work tickets that are created by customers and then worked on, and closed some time (days) later.
I need a chart that show both of these volumes on a common month dimension. Since I cannot select Create Date nor Closed date, as this would show incorrect data, I created an independent calendar and use an if statement to count the Created and the Closed tickets. So I select a period ( in the below example Month) on the independent calendar to get the chart results.
example of the if statement for Created Tickets:
count(distinct if([TicketCreateDate]= CalendarDate,[Ticket Number]))
and for Closed Tickets
count(distinct if([TicketCloseDate]= CalendarDate,[Ticket Number]))
example of chart
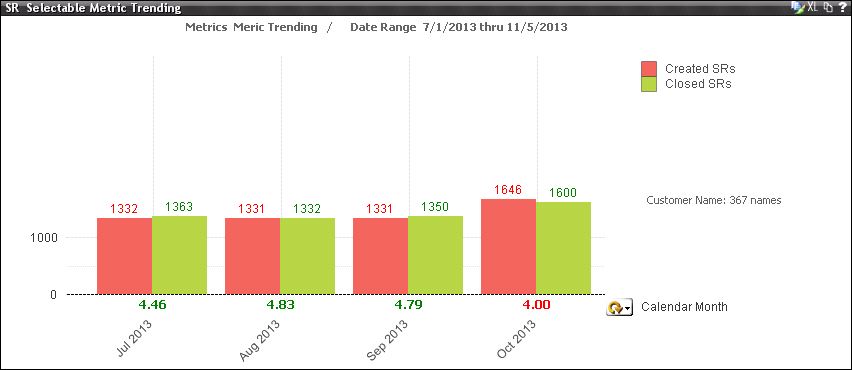
Now this works perfectly fine. The problem is that when I have a large set of data 5 to 10 million records it is incredible slow. The reason is that it compares every record against every Selected Calendar date for closed AND open.
So my question is how can I accomplish the same thing but with a faster response time? I did try set analysis but it did not seem to be faster, but perhaps I implemented it incorrectly.
I suspect there is a good solution to this.
Jim
Accepted Solutions
- Mark as New
- Bookmark
- Subscribe
- Mute
- Subscribe to RSS Feed
- Permalink
- Report Inappropriate Content
Either modify an existing table or create a new table with something like this:
TicketDates:
Load distinct [Ticket Number], TicketCreateDate as CalendarDate, 0 as OpenClose
from ...tickettable... ;
Load distinct [Ticket Number], TicketCloseDate as CalendarDate, 1 as OpenClose
from ...tickettable... ;
You can then use the new OpenClose field in the expressions:
Opened SRs: count({<OpenClose={0}>} [Ticket Number])
Closed SRs: count({<OpenClose={1}>} [Ticket Number])
0 and 1 are just examples. Strings like 'Open' and 'Close' work too, but perhaps a little slower.
talk is cheap, supply exceeds demand
- Mark as New
- Bookmark
- Subscribe
- Mute
- Subscribe to RSS Feed
- Permalink
- Report Inappropriate Content
Thank you Gysbert. This answer is correct. However I have a follow on question. For counts this works fine and it speed it up a great deal. But I neglected to say that I also want averages of certain fields. Averages work with this also provided that Incidents Numbers only have one line each. But I have duplicate Incidents Numbers and this is ok for counts as I can count distinct.
But if I want to average a field I need to average it against each unique Incident number. I can't seem to get the logic for averaging (using aggr) against a unique field entry.
for instance if I have
Incident Number Field X
12345 5
12345 5
54321 3
So the average of these 2 incidents is 5+3 / 2 = 4 NOT 5+5+3 /3 = 4.3
Any ideas on that would be appreciated.
Basically I want to
average (Field X)
but only selecting distinct Incident Numbers
- Mark as New
- Bookmark
- Subscribe
- Mute
- Subscribe to RSS Feed
- Permalink
- Report Inappropriate Content
Hi Jim,
You can also use avg(distinct Field X) as one of your measure.
Regards
Nitin Guta